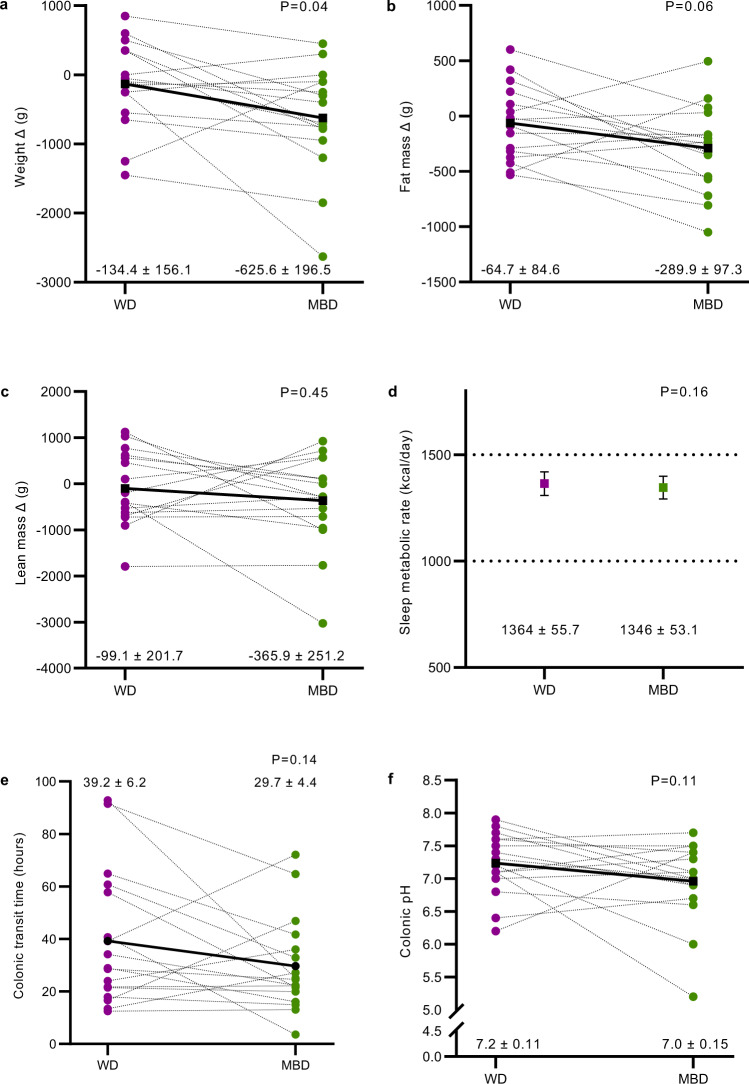
Fig. 4. Host energy stores and energy expenditure in response to diet-gut microbiome interactions.
a–c Weight, fat mass and lean mass changes on the WD vs. MBD; n = 16 per diet. d Energy expenditure (sleep metabolic rate extrapolated to 24-h); e, f Colonic transit time and median colonic pH; n = 17 per diet for all panels. Error bars in panel c are displayed as s.e.m. P values are from linear mixed effects regression models and denote a statistically significant effect of diet on each endpoint. Source data are provided as a Source Data file.

