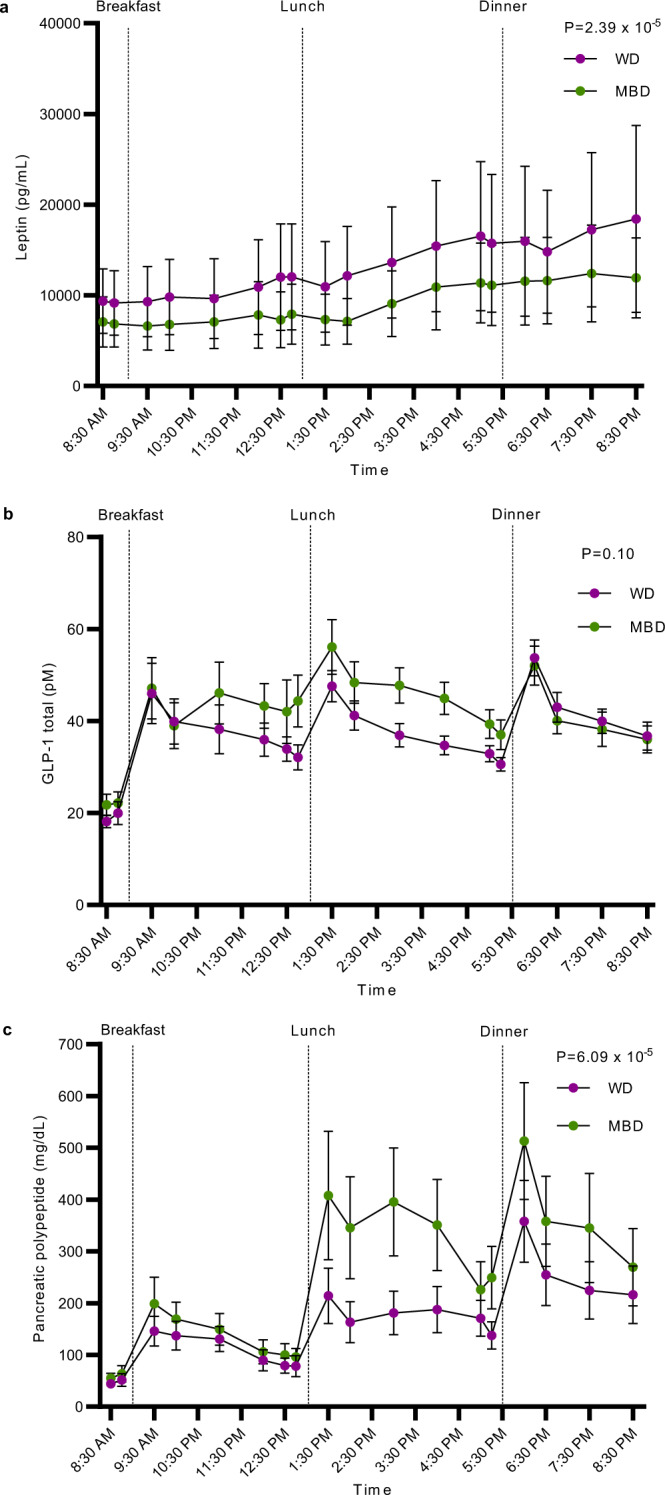
Fig. 5. An adipose-pancreas-gut appetite-modulating axis in response to diet.

a–c Leptin, GLP-1, and pancreatic polypeptide iAUC, respectively (N = 15 per diet). All data reported as mean ± s.e.m. P values are from linear mixed effects regression models and denote a statistically significant effect of diet (or trend for an effect in the case of total GLP-1) on each hormone. Source data are provided as a Source Data file. GLP-1 Glucagon-Like Peptide 1, iAUC Incremental Area Under the Curve, MBD Microbiome Enhancer Diet (green), WD Western Diet (purple).
