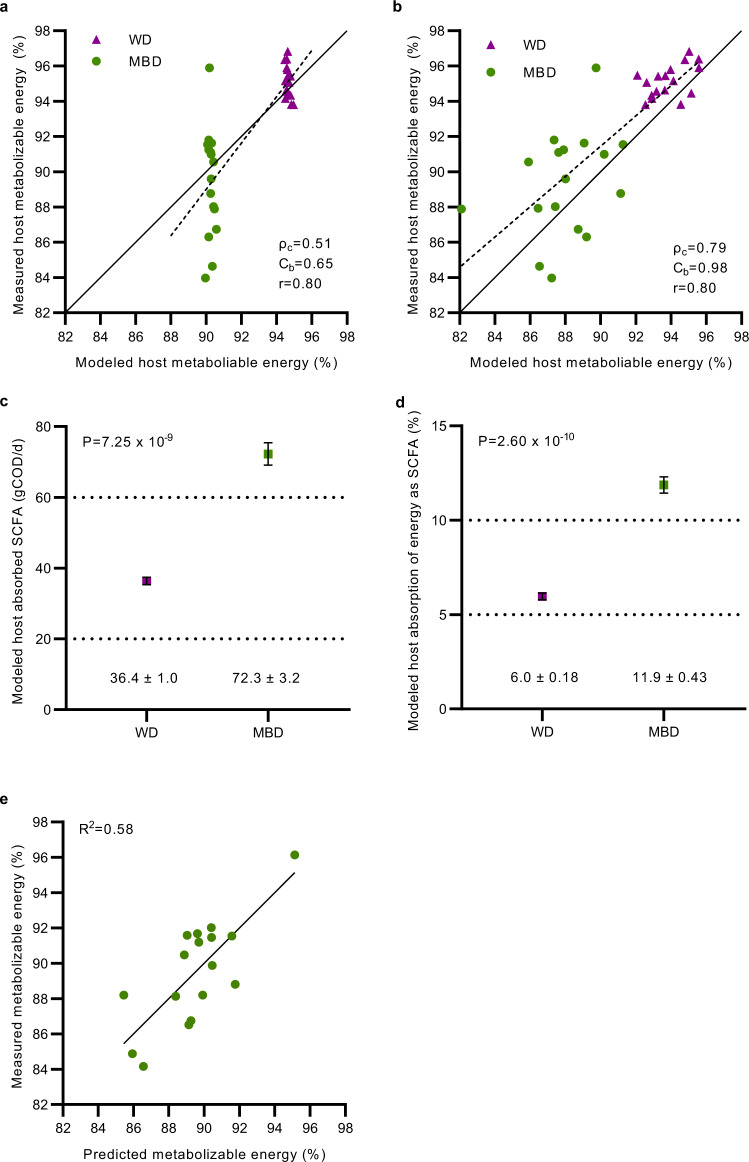
Fig. 6. The contributions of the gut microbiome to host metabolizable energy.
a Concordance correlation coefficient plot between predicted (by modeling) and measured host metabolizable energy (ME) using the same fixed CTT (48 h) for all participants. Dashed line is a simple linear regression between pairs of data; solid line is the identity line (perfect reproducibility between measured and modeled data). b The same plot with each participant’s measured CTT. c Plot shows total energy absorbed by the host as SCFAs in grams COD per day (gCOD/day) for the WD and the MBD. gCOD were calculated as the sum of acetate, propionate, n-butyrate, and iso-butyrate absorbed. d The percentage of COD absorbed as SCFAs adjusted for total energy intake (in gCOD/day). e Scatterplot of predicted and measured host ME on the MBD; predicted host ME was obtained from the model selection procedure which estimated that 6-day fecal propionate and 16S rRNA gene copy number (a surrogate of biomass) jointly explained 58% of the variance in host ME. Thus, the R-squared for the simple linear regression of predicted and measured host ME is 0.58. N = 17 per diet for all panels. For panels c and d, data reported as mean with error bars showing the s.e.m. A paired samples t-test by diet was used to generate the P values in panels c and d. Source data are provided as a Source Data file. ρc concordance correlation coefficient (reproducibility), Cb bias correction factor (accuracy), COD Chemical Oxygen Demand, CTT Colonic Transit Time, Host ME Host Metabolizable Energy, IQR Interquartile Range, MBD Microbiome Enhancer Diet (green), SCFA short-chain fatty acids, r Pearson’s correlation coefficient (precision), RA Relative Abundance, WD Western Diet (purple).

