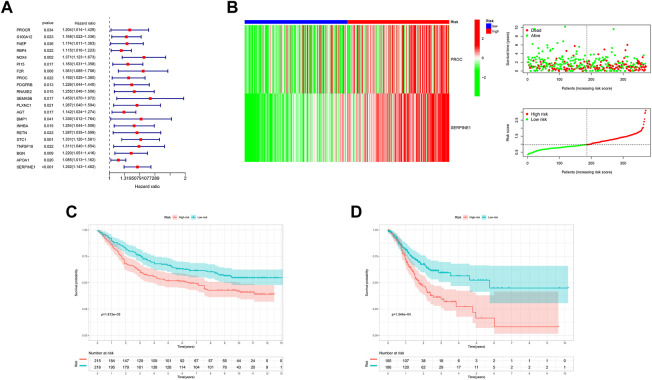
FIGURE 4.
Establishment Risk Assessment Model and Survival outcomes in GC. (A) 21 CD4+ T cells-related hub genes Through a univariate Cox survival analysis in MEblue module. (B) The distribution plot of the Risk score with survival times. (C, D) Kaplan-Meier analysis of the OS between the two risk groups in the GSE84437 and TCGA cohort.

