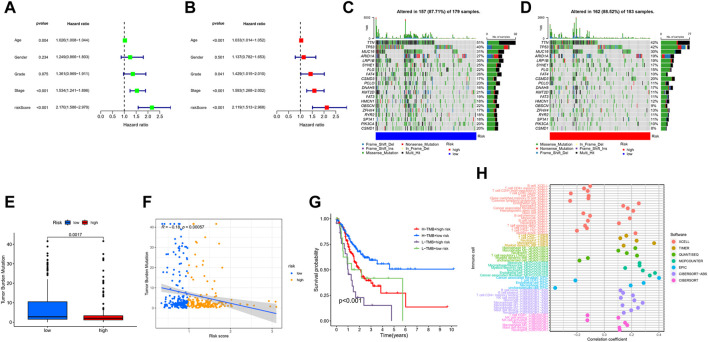
FIGURE 8.
Characteristics in clinicopathology and gene mutation in GC. (A, B) The univariate and multivariate cox regression analysis in Risk-score subgroups. (C, D) Significantly mutated genes in the mutated GC samples of the high and the low risk groups, respectively. Mutated genes (rows, top 20) are ordered by mutation rate; samples (columns) are arranged to emphasize mutual exclusivity among mutations. The right shows mutation percentage, and the top shows the overall number of mutations. The color-coding indicates the mutation type. (E) The TMB of two different risk subgroups. (F) Relationships between Risk-score and TMB. (G) The prognosis of GC in different Risk-score and TMB subgroup. (H) The prognosis of GC in different Risk-score and TMB.

