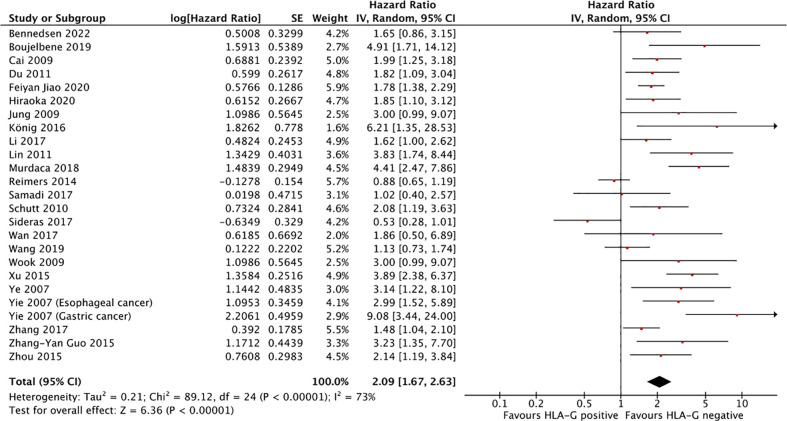
Figure 2.
Forest plot showing hazard ratio for OS for HLA-G positive. Hazard ratios for each study are represented by the squares, the size of the square represents the weight of the study in the meta-analysis, and the horizontal line crossing the square represents the 95% confidence interval (CI). All statistical tests were two-sided.

