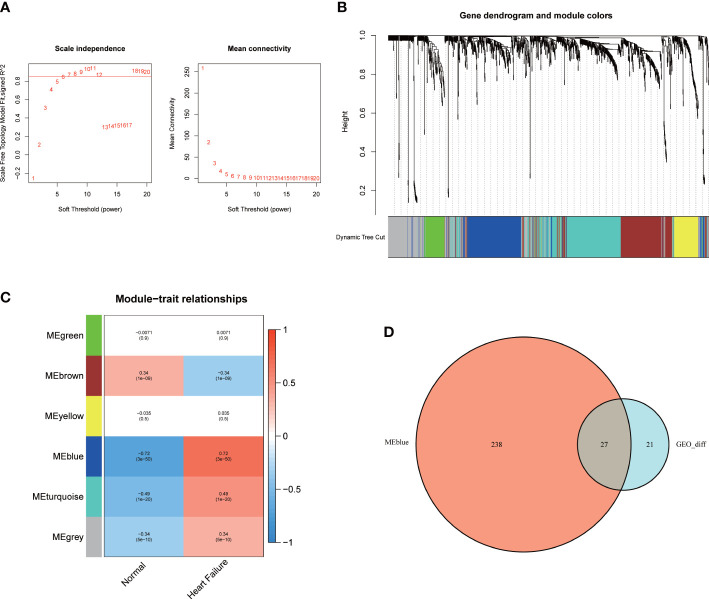
Figure 2.
The WGCNA analysis and identification of candidate hub genes. (A) The soft threshold power and the mean connectivity of WGCNA. (B) The cluster dendrogram of WGCNA. (C) The clustered modules of WGCNA. (D) The venn diagram showed the interactions between the DEGs and genes in the MEblue module.

