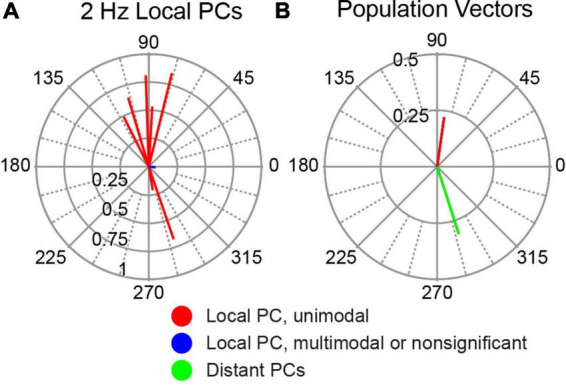
FIGURE 10.

Modulation of SS activity of PCs located directly underneath stimulation site. (A) Polar plot of individual cell circular means of the 10 local PCs to 2 Hz AC stimulation. (B) Comparison of population vector of local PCs shown in panel (A) (red) with that of distant PCs (blue) redrawn from Figure 5A (2 Hz).
