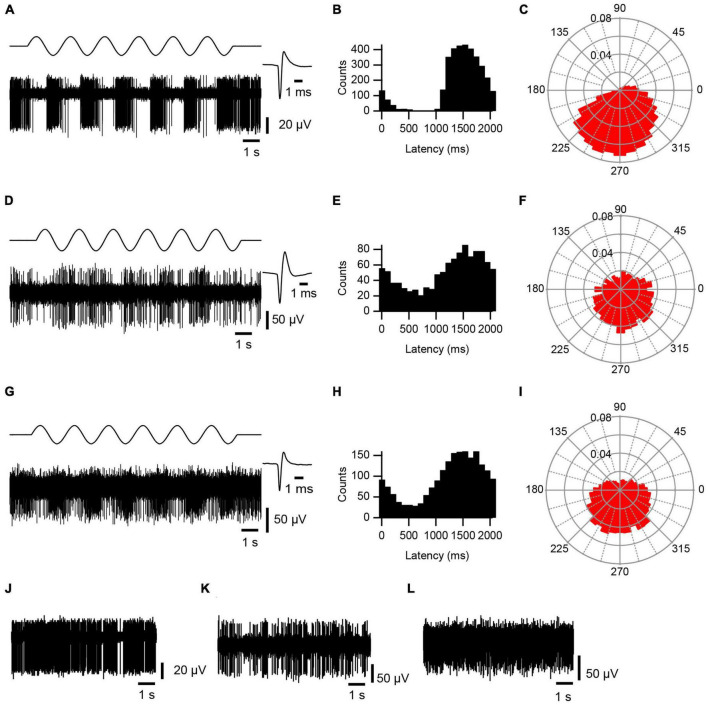
FIGURE 2.
AC modulation of cerebellar activity. Responses of PC SS (A–C), CN (D–F) and VN (G–I) activity to ∼0.5 Hz AC stimulation. (A,D,G) Bottom trace of each panel is an extracellular recording of PC, CN cell, and VN cell, respectively. Top trace shows AC stimulation. Average waveform for each cell is shown at an expanded time scale to the right (n = 500 spikes). (B,E,H) Histograms of spike activity triggered of off the start of each sinusoidal cycle. Histograms compiled from 6 to 9 stimulus trains, each consisting of 6 complete cycles. Bins were set to 1/20 of the cycle period (∼100 ms for ∼0.5 Hz). (C,F,I) Rose plots showing the phase distribution of activity relative to the start of the sinusoidal cycle. Radial axis plots fraction of spikes. Bin size is 10°. (J–L) Spontaneous activity of the PC (J), CN (K), and VN (L) cells shown in panels (A,D,G), respectively.

