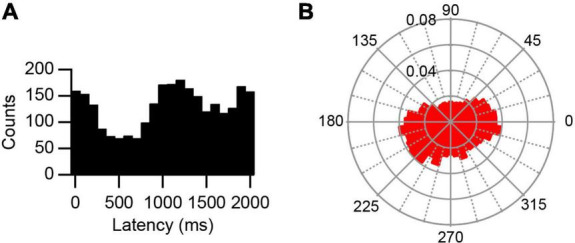
FIGURE 3.

Bimodal response to AC stimulation. (A) Histogram of PC SS activity triggered off of the start of the sine wave cycle during 0.5 Hz stimulation. Note one peak shortly after 1,000 ms and one that spans the ends of the histogram. (B) Rose plot shows increased responses occurred between 345° – 30° and between 180° – 240°.
