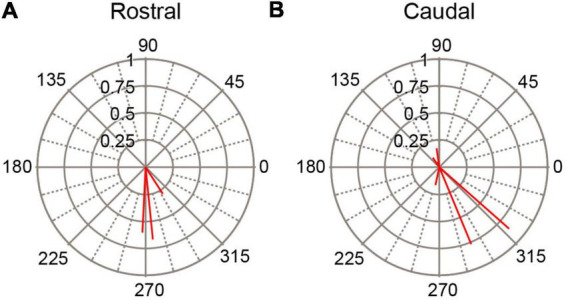
FIGURE 7.

Variation of SS modulation with rostrocaudal location of PC. Polar plots of circular means for SS activity for (A) PCs located in lobules rostral to site of stimulation (crus1) and for (B) PCs located in lobules caudal to stimulation site. AC stimulus frequency was 0.5 Hz.
