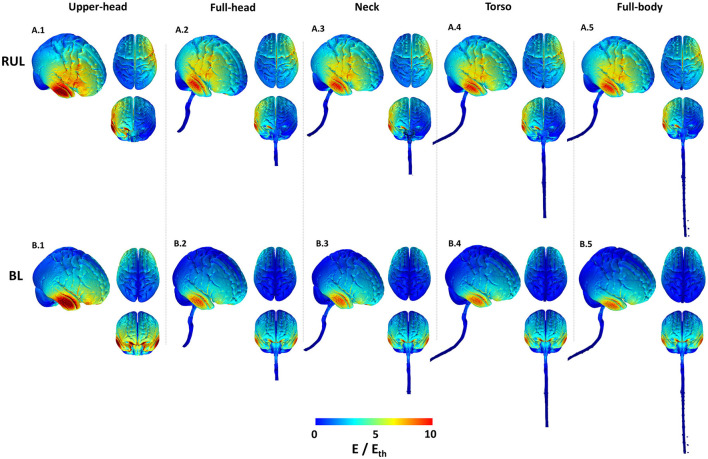
Figure 2.
Cortical 3D surface E-field magnitude plots of the RUL and BL electrode configurations across all extents. The images indicate E-field strength relative to the neural activation threshold (Eth = 0.25 V/cm). The images are plotted to the same scale to highlight differences. For each combination, the right lateral view along with the top and anterior views are shown.

