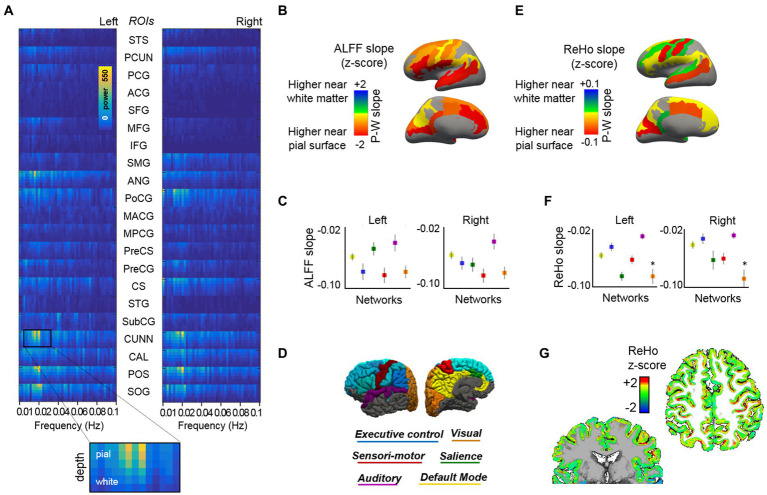
Figure 2.
Cortical depth-dependent resting-state activity. (A) Mean layer-specific frequency-power decomposition of the BOLD signal in 21 ROIs (both cerebral hemispheres), averaged across 13 subjects. (B) Brain surface maps showing the average slope of the fitting line that best approaches the depth-varying ALFF per ROI. (C) ALFF slope for each cortical network. (D) The figure displays the regions that were included in the functional analysis, organized by network, over the surface of the brain (see Table 1 for a detailed description of the ROIs included). (E) Brain surface maps showing the average ReHo slope of the fitting line that best approaches the depth-varying ReHo per ROI. (F) ReHo slope for each cortical network. (G) Representative ReHo map projected from six cortical surfaces to volume space. Results based on equi-distant layer sampling (for a comparison of ALFF and ReHo results in the whole-brain, gyri, and sulci when using an equi-distance or an equi-volume sampling model, see Supplementary Figures S7, S8).

