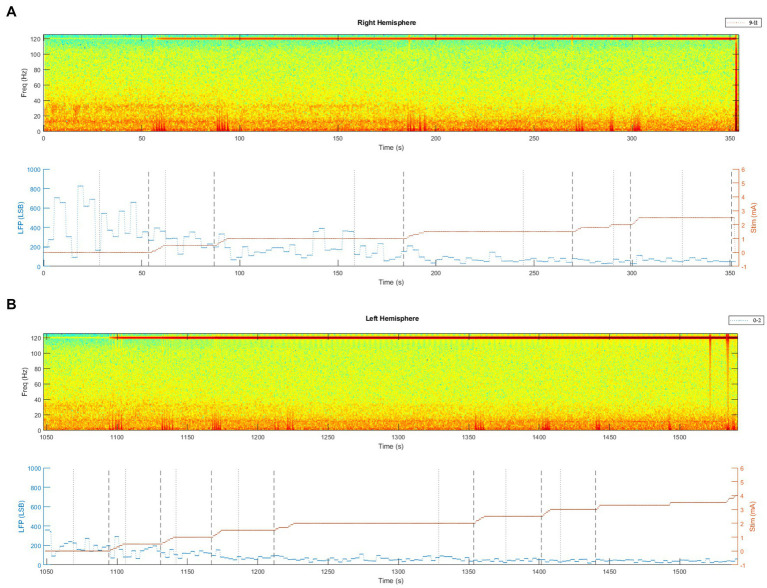
Figure 1.
Spectrum of the raw LFP, recorded via the Brainsense™ Streaming, during stimulation titration at the initial DBS programming session. (A) Brainsense™ Streaming LFP recordings during stimulation titration in the right STN. In the upper part of the graph: spectrograms extracted from the raw LFP (stimulation at contact #10, sensing at contacts #9 and #11). In the lower part of the graph: LFP plotted over time, together with stimulation titration (mA). (B) Brainsense™ Streaming LFP recordings during stimulation titration in the left STN. In the upper part of the graph: spectrograms extracted from the raw LFP (stimulation at contact #1, sensing at contacts #0 and #2). In the lower part of the graph: LFP plotted over time, together with stimulation titration (mA).

