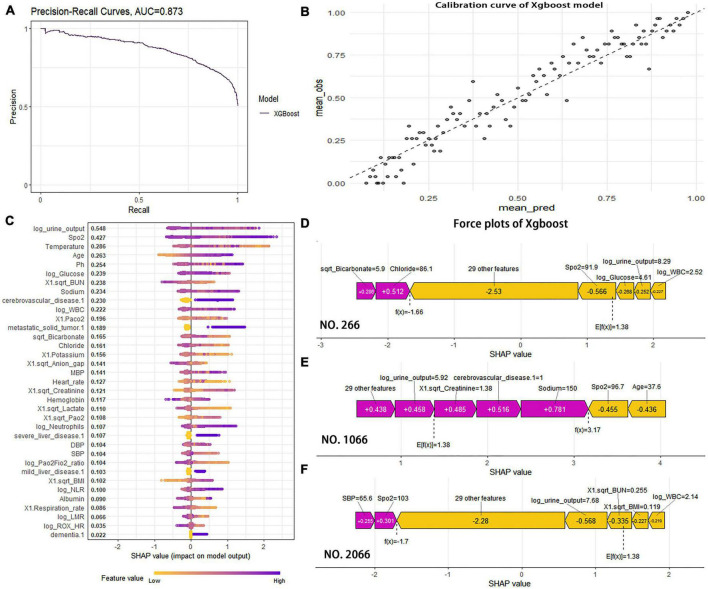
FIGURE 5.
(A) The precision-recall (PR) curve was used further to evaluate the classification ability of the XGBoost model; AUCPR (0.873) indicated the model performed well in predicting case classification. (B) The calibration curve showed high coherence between the predicted and actual probability of XGBoost model. (C) The features are ranked according to the sum of the SHAP values for all patients, and the SHAP values are used to show the distribution of the effect of each feature on the XGBoost model outputs. (D) The sharp value force plot of case 266 was used to individually predict the characteristic variables. (E) The sharp value force plot of case 1066 was used to individually predict the characteristic variables. (F) The sharp value force plot of case 2066 was used to individually predict the characteristic variables.

