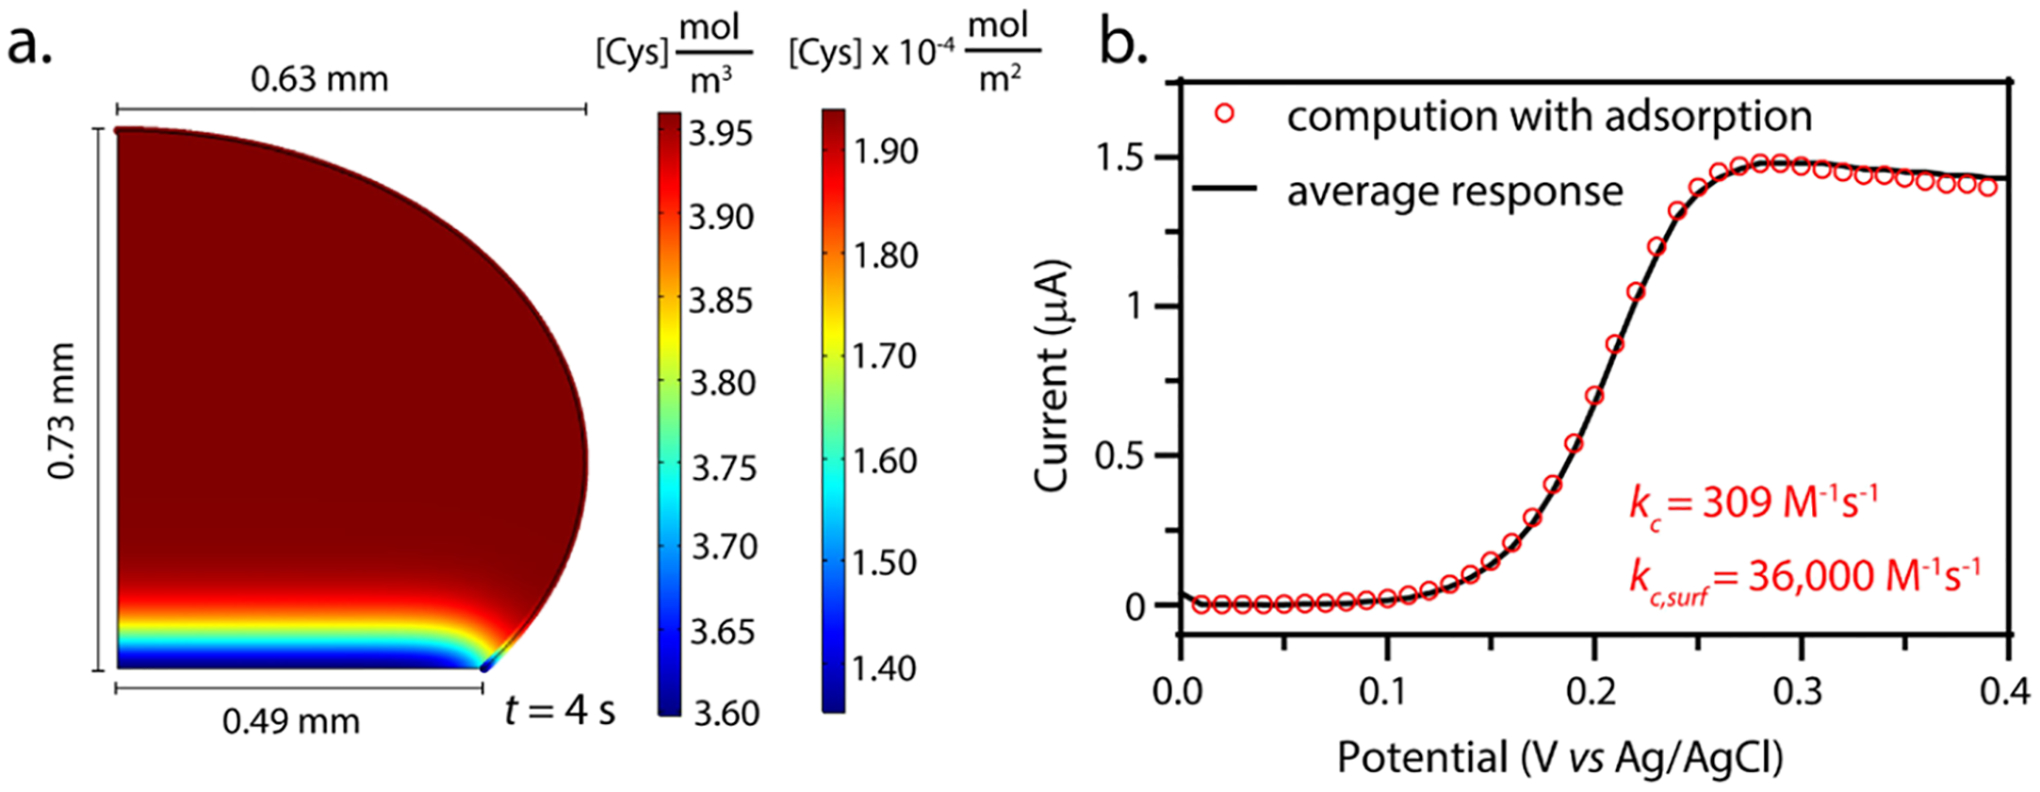
Figure 4.

(a) 2D plot of the simulated droplet geometry from the photograph in Figure 3b. The domain coloring shows the concentration of cysteine (mol/m3) in the droplet and the boundary coloring shows the surface concentration of the adsorbed cysteine (mol/m2) at 4 s. The thickness of the adsorbed layer gradient is exaggerated for visibility and is not to scale with the rest of the geometry. (b) Simulated voltammetry for the adsorption model (red circles) overlaid with a voltammogram of the average response (kc,app = 490 M−1 s−1) in the confined system (black line). For the adsorption model fit, the kc value was set at 309 M−1 s−1 (average bulk measurement) and kc,surf was adjusted to 36,000 M−1 s−1 (scan rate = 0.1 V/s).
