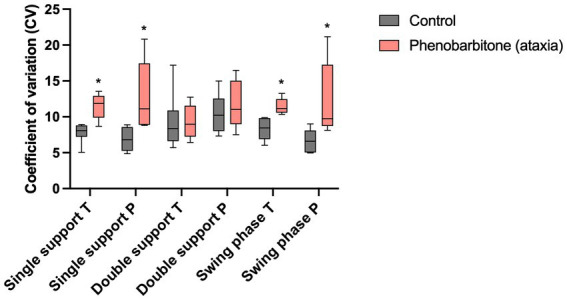
Figure 3.

Coefficients of variation (CV) of spatio-temporal gait parameters. CVs of a non-ataxic control group were compared to those of a PB-treated ataxic IE study group. CVs of single support phase, as well as swing phase of both limb pairs showed significantly higher variability in the study group than in controls. *p ≤ 0.05, Mann–Whitney test. T, thoracic limbs; P, pelvic limbs.
