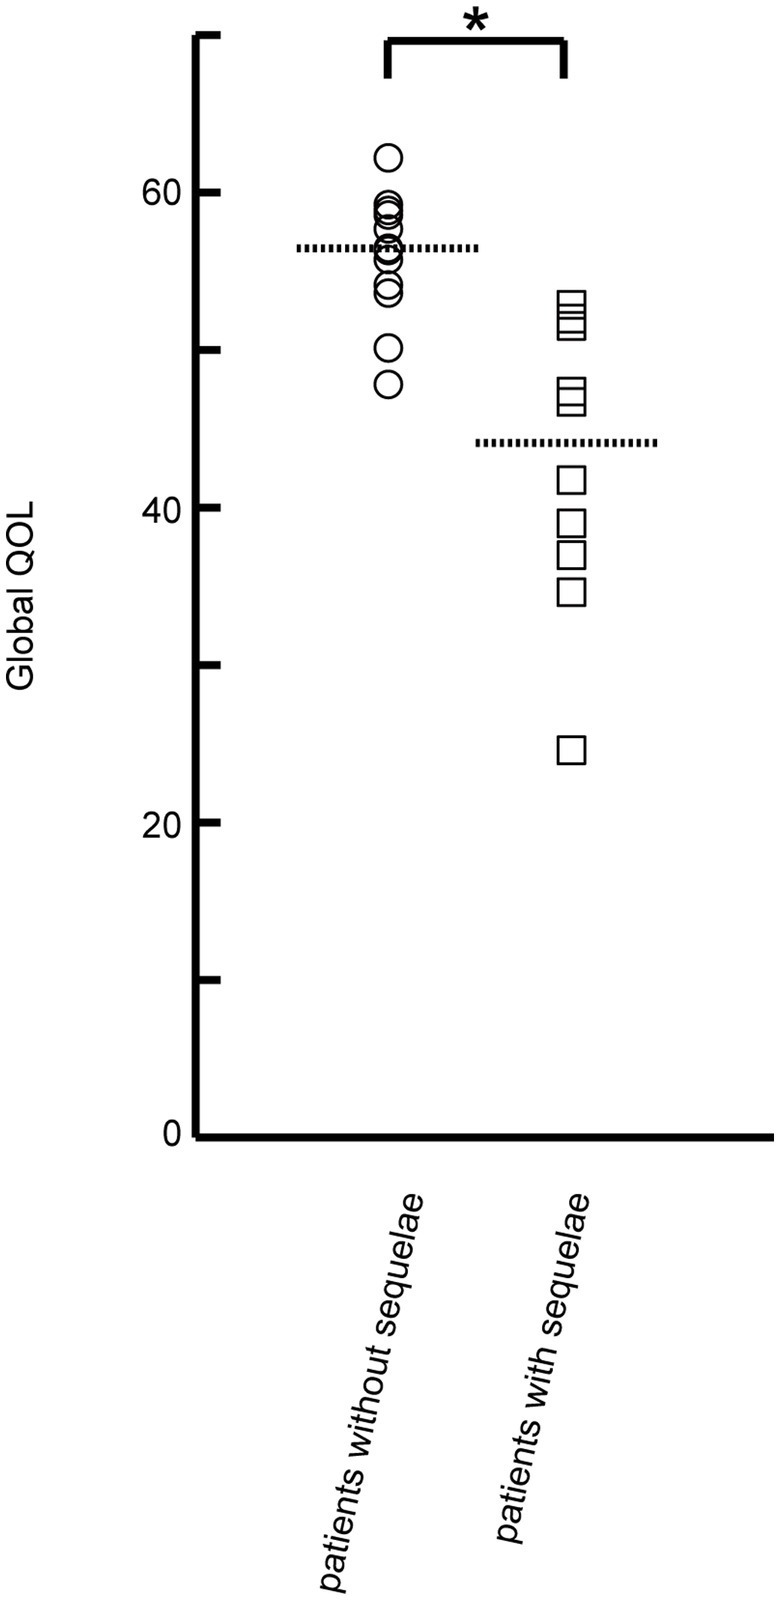
Figure 2.

Comparison of Global QOL between patients with and without sequelae. Global QOL was calculated for each patient based on the T-scores of 12 NeuroQOL battery domains. Patients with sequelae (n = 10) had significantly worse Global QOL than those without sequelae (n = 12; 44.2 vs. 56.4, p < 0.001). Circles indicate the Global QOL of patients without sequelae; squares indicate the Global QOL of patients with sequelae. The dotted lines indicate the median Global QOL for patients with and without sequelae. Statistically significant differences in Global QOL were detected between patients without and with sequelae using the Mann–Whitney U-test: *p < 0.001.
