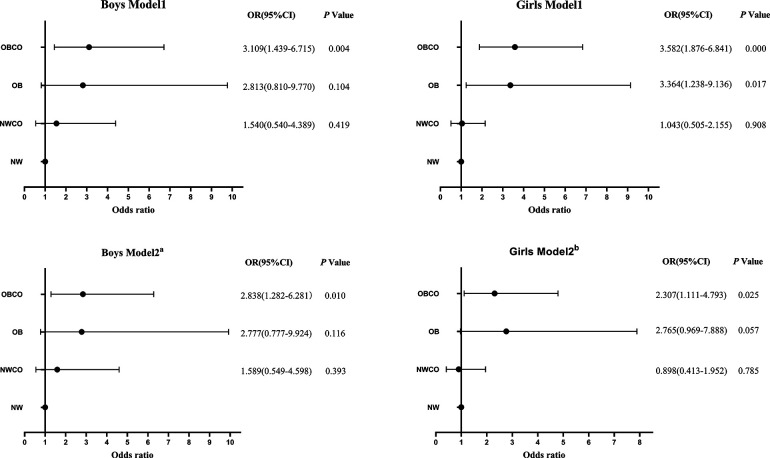
Figure 2.
OR and 95% CI for hyperuricemia in different obesity types. Model 1: adjusted for age. Model 2a: adjusted for model 1 + TC + CYSC. Model 2b: adjusted for model 1+ TG + TC + LDL + CYSC and SBP. OR, odds ratio; 95% CI, 95% confidence interval, NW, normal weight without central obesity; NWCO, normal weight with central obesity; OB, obesity without central obesity OBCO, obesity with central obesity.

