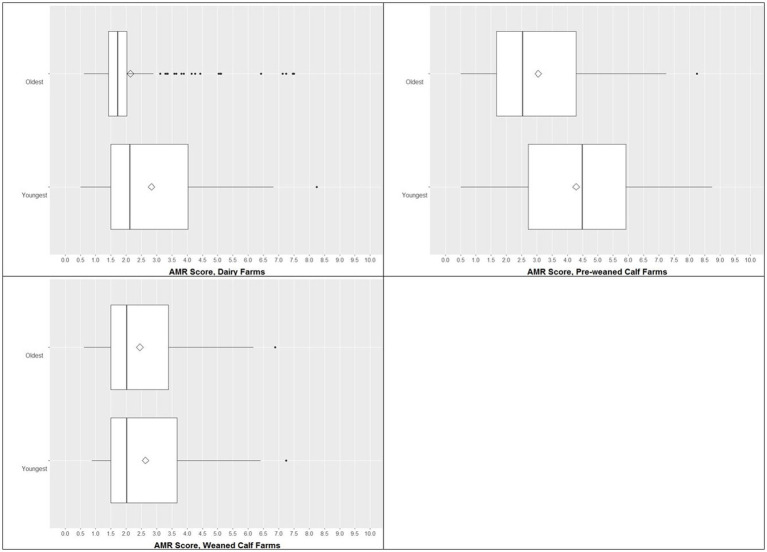
Figure 3.
Boxplots of AMR score in the youngest and the oldest animal groups of dairy farms [n = 430 isolates (230 youngest, 200 oldest)], pre-weaned calf farms [n = 781 isolates (400 youngest, 381 oldest)], and weaned calf farms [n = 390 isolates (190 youngest, 200 oldest)]. The box represents the interquartile range (central 50% of the data), the solid vertical line represents the median, and ◊ represents the mean. Dots are >1.5 standard deviations from the mean.

