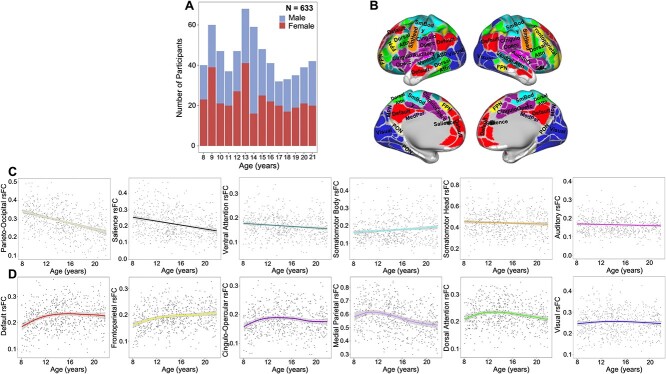
Fig. 2.
(A) Age by sex sample distribution. (B) Gordon 333 parcellation adapted from Gordon et al. (2016). (C) Linear within-network age-related differences in rsFC of the six networks with a statistically significant (FDR-corrected) linear relationship with age. (D) Non-linear within cortical network age-related differences in rsFC for the 6 networks with a statistically significant non-linear relationship with age, based on a restricted likelihood ratio test of the GAM. rsFC, resting state functional connectivity. Shaded bands around lines represent 95% confidence interval. Scatterplots represent differences in rsFC as a function of age and do not account for covariates.

