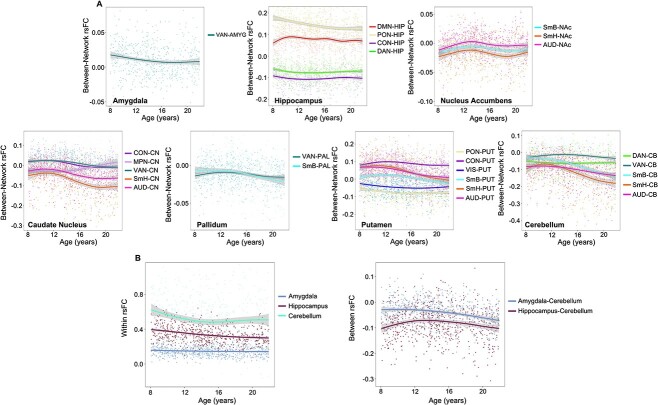
Fig. 5.
(A) Non-linear differences between cortico-subcortical and cortico-cerebellum rsFC. Plots are aggregated by subcortical region. (B) Non-linear differences within and between subcortico-cerebellum rsFC. rsFC, resting-state functional connectivity. Shaded bands around lines represent 95% confidence interval.

