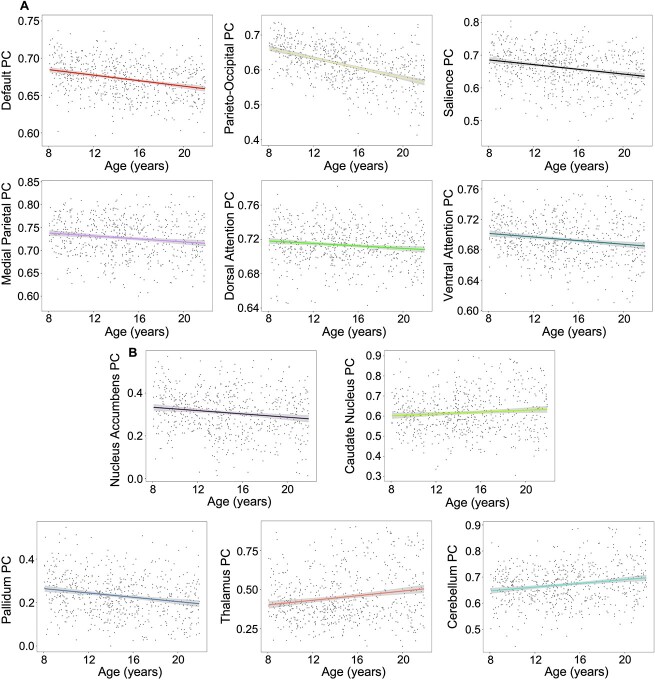
Fig. 7.
(A) Linear differences in cortical PC. All plots represent significant linear differences that passed FDR correction. (B) Linear differences in subcortical PC. All plots represent significant linear differences that passed FDR correction. PC, participation coefficient; shaded bands around lines represent the 95% confidence interval.

