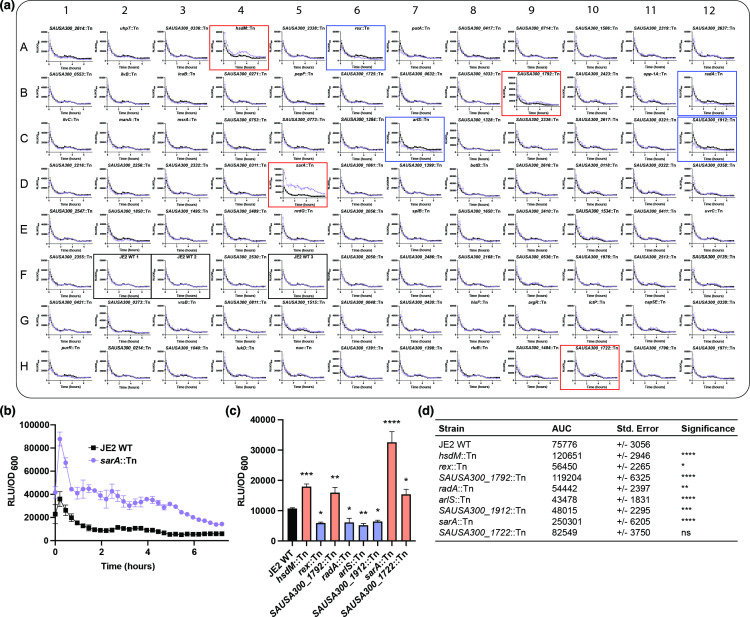
Fig. 2.
Examining P aur activity in numerous transposon mutants. (a) JE2 wild-type (WT) and transposon mutants carrying pXen-1-P aur-luxABCDE were grown for 7 h and bioluminescence and OD600 were assessed every 15 min. The experiment was repeated three times and data for each well were combined. Purple lines show data generated from specific wells (e.g. individual mutants), while black lines represent the average of three biological replicates as well as three technical replicates for JE2 WT. Black boxes denote the parental strain. Red and blue boxes indicate strains with increased and decreased bioluminescence, respectively. Data are represented as relative light units (RLU) normalized by optical density (OD600) to account for potential growth differences among transposon mutants. (b) Enlarged representative graph of (a) showing reporter activity for the sarA::Tn mutant (purple) and JE2 WT (black). (c) Comparison of bioluminescent signals from selected mutant strains and JE2 WT at 3.5 h of growth. (d) Curves from (a) were utilized to determine and compare the area under the curve (AUC) for the parental strain and selected mutants. Data in (b) and (c) were analysed by one-way ANOVA comparing each transposon mutant to the JE2 parental strain. Significance is denoted as: *P<0.05, **P<0.01, ***P<0.001, ****P<0.0001, ns – not significant.

