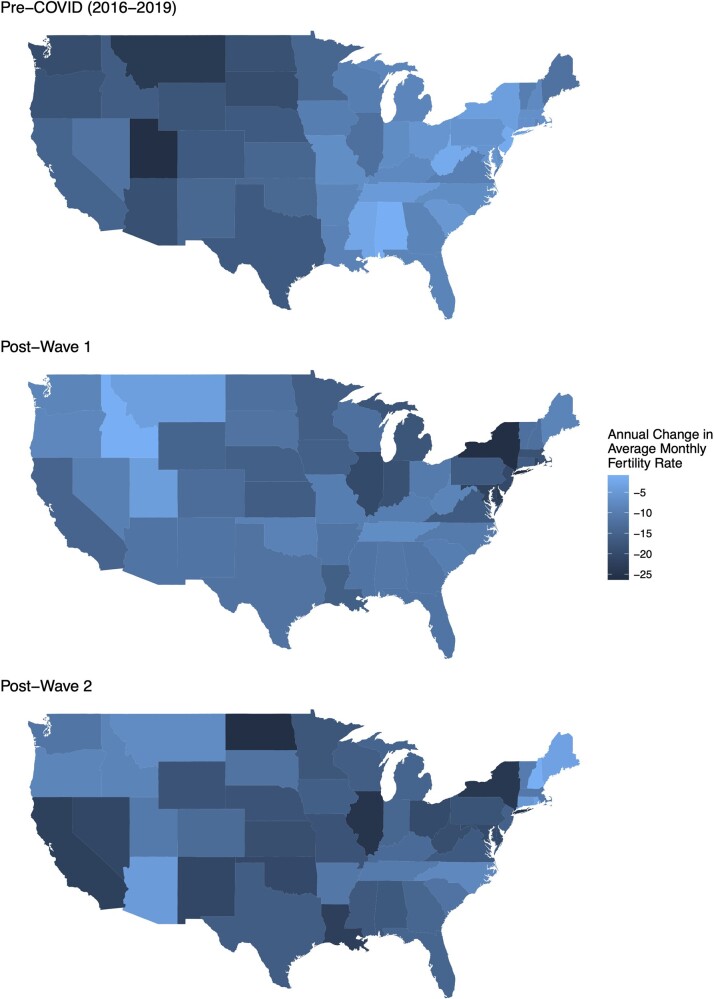
Figure 2.
State-specific annual fertility rate change for pre-pandemic period, post-Wave 1 and post-Wave 2 for each US state. The top map of the USA shows state-specific annual change in fertility rate (average monthly births/100 000 women of reproductive age) pre-coronavirus disease 2019 (COVID) (averaged from 2016 to 2019). The middle and bottom map shows the state-specific annual change in fertility rate following Wave 1 and Wave 2, respectively.

