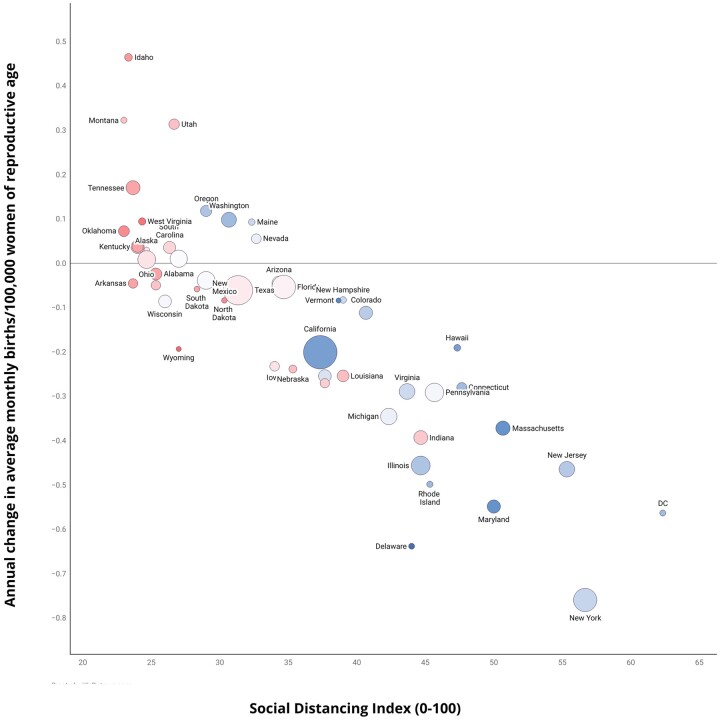
Figure 3.
Annual fertility rate change in the USA in relation to social distancing index and political leaning following Wave 1. Following Wave 1, fertility rate change is correlated with Social Distancing Index (x-axis) and political leaning (red: Republican, blue; Democrat). Social Distancing Index is a scale from 0 to 100, with higher values indicating greater levels of social distancing. Political leaning is the percentage of the state that voted Republican in the 2020 election. The size of the point indicates the number of women of reproductive age in that state during 2020.

