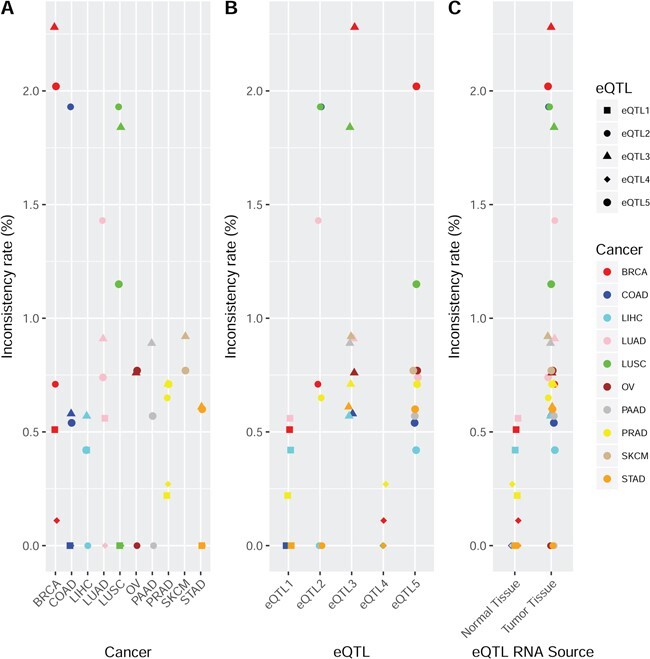
Figure 2 .

This figure presents the directional inconsistency rates among the shared eQTLs for TCGA versus GTEx. The detection threshold for eQTL in TCGA was FDR < 0.05. A. Directional inconsistency rate by cancer type in TCGA versus GTEx. No significantly different directional inconsistency rate was observed among tissue types. B. Directional inconsistency rate by eQTL type in TCGA versus GTEx. eQTL1 and eQTL4 were found to have significantly less directional inconsistency compared to other eQTL types. eQTL3 was found to have a significantly higher directional inconsistency rate compared to other eQTL types. These results reflect the fact that when the source of gene expression is the same as GTEx (normal tissue), the eQTLs are more likely to be concordant. When the source of gene expression was dramatically different (normal versus tumor tissues), the eQTLs are more likely to be in directional conflict. C. Directional inconsistency rate by source of the gene expression in TCGA versus GTEx. eQTLs produced from tumor tissues clearly had higher inconsistency rates than eQTLs produced from normal tissues compared to GTEx. This reiterates the point that the source of gene expression has more impact than the source of SNP for eQTLs.
