Figure 3 .

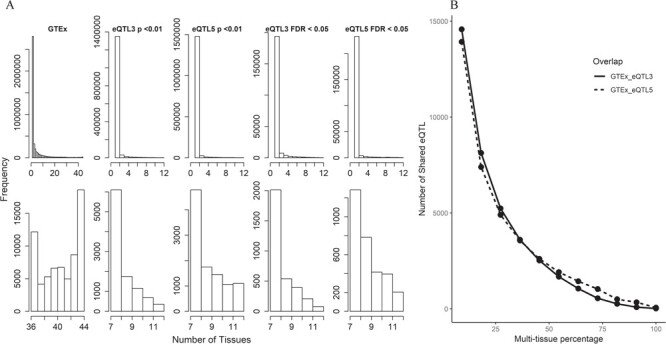
Analysis results for multi-tissue eQTLs in TCGA and GTEx. eQTL3 and eQTL5 from BRCA in TCGA were selected for this analysis due to their large sample size. Two eQTL detection thresholds were used (P < 0.01 and FDR < 0.05). A. Histograms display the distribution of multi-tissue eQTLs. The top panel of the histograms shows that the majority of the eQTLs are tissue specific or were associated in a low number of tissues. The lower panel of the histograms magnifies the right end tails of distributions in the upper panel. A smoother declining tails can be observed in TCGA data than in GTEx. This might be due to the fact that TCGA has much smaller number of tissue types. The GTEx also had smooth declining patterns until the right end of the tails. B. This figure depicts the negative relationship between shared multi-tissue eQTLs and percentage of all available tissue types. The analysis contains 44 tissue types from GTEx and 12 cancer types from TCGA. We roughly split the number of tissue and cancer types by ∼8–9% interval and computed the shared multi-tissue eQTLs.
