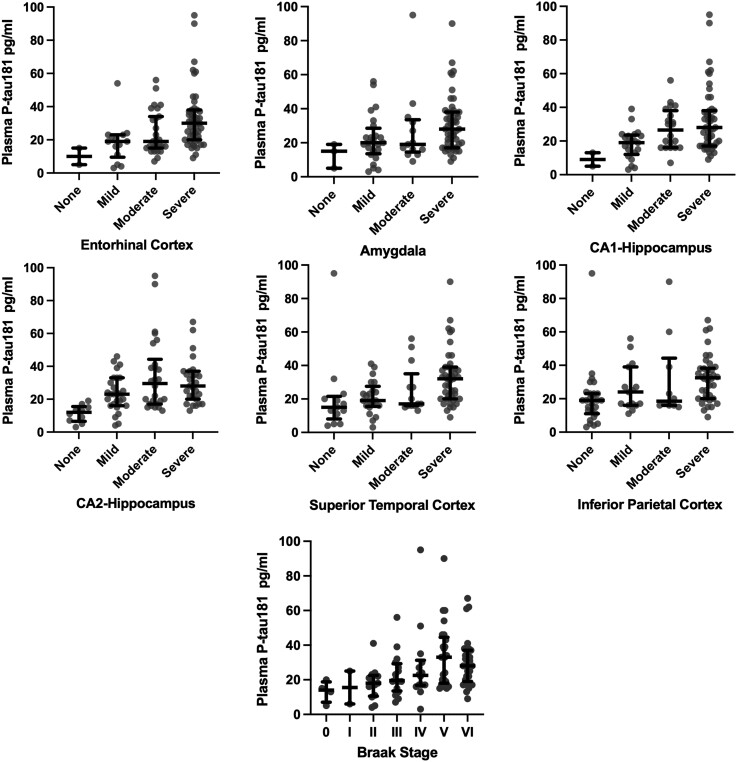
Figure 3.
Distribution of plasma p-tau181 by p-tau severity ratings at autopsy. Figure shows the median (bar) and interquartile range (whiskers) as well as the individual data points for plasma p-tau181 levels by Braak staging of neurofibrillary tangles, as well as hyperphosphorylated tau severity across six cortical and subcortical brain regions rated at autopsy using a 0 (none) to 3 (severe) scale. As shown in Table 3, ordinal logistic regression controlling for age at death, years between last blood draw and death, sex and APOE ε4 status showed higher plasma p-tau181 levels were associated with increased odds for more severe Braak stage and p-tau severity across all of the regions (Ps < 0.05). p-tau = phosphorylated-tau.

