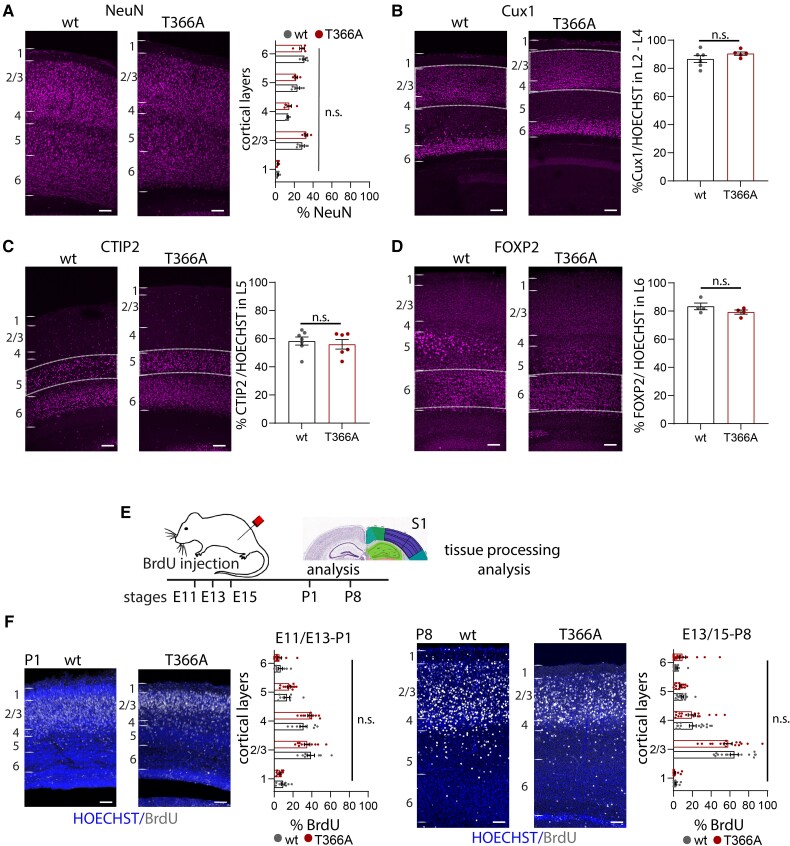
Figure 2.
Cortical layers and proliferation in PtenT366A/T366A brains. (A–D) Immunolabelling for cortical layer markers and the percentages of neurons expressing in PtenT366A/T366A and wild-type (wt) mice. (A–D) The percentage of (A) NeuN+ neurons in cortical layers 1 to 6. (B–E) The percentage of (B) Cux1+ neurons in cortical layers 2–4, (C) CTIP2+ neurons in L5, (D) FOXP2+ neurons in L6 in relation to all neurons counterstained with HOECHST. (E) Proliferation of cortical progenitor cells in PtenT366A/T366A and wild-type siblings. Schematic for experimental set-up, BrdU injections were performed in time-pregnant heterozygous females at E11.5, E13.5 and E15.5. Analysis was undertaken at P1 and P8. (F) Example images of BrdU labelling and HOECHST counterstain at P1 and P8. Graphs showing distribution of BrdU+ neurons in PtenT366A/T366A and wild-type mice at P1 and P8, respectively. Each dot in graphs accounts for one brain section. Statistical analysis with unpaired t test and two-way ANOVA, Bonferroni post hoc test. For analysis details see Supplementary Table 4. Scale bars = 100 µm.

