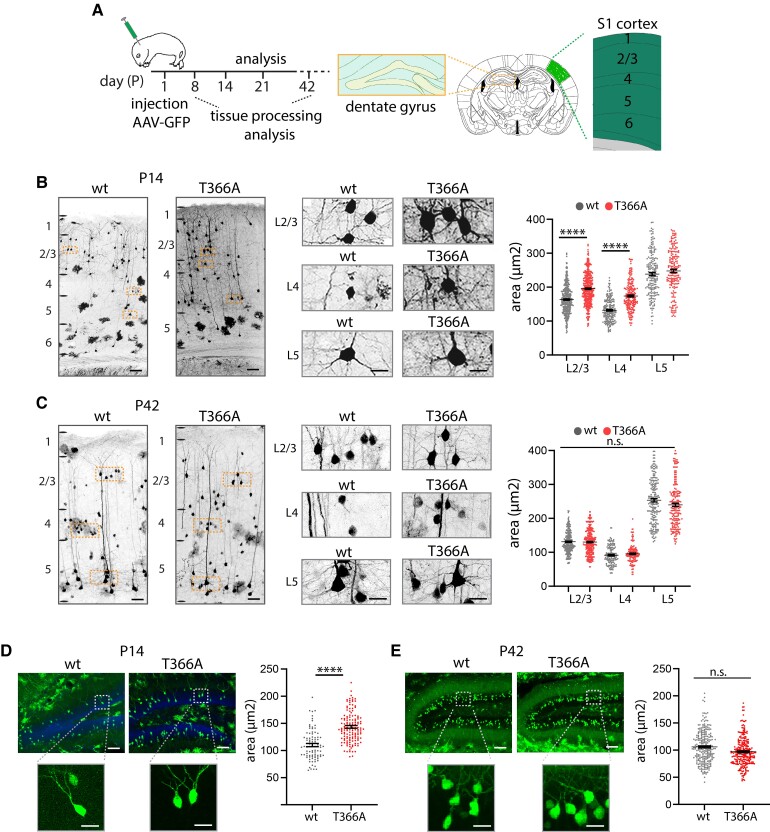
Figure 3.
Soma size in PtenT366A/T366A cortical and dentate gyrus neurons. (A) Schematic of AAV-GFP injection at P0 and expression of GFP in adult S1 cortex and dentate gyrus. Soma size was analysed at P14 and P42. Staining with HOECHST and the Allen brain mouse reference atlas were used to define cortical layers (also see the ‘Materials and methods' section). (B and C) GFP-injected neurons at P14 (B) and P42 (C) for PtenT366A/T366A and wild-type (wt) mice. Enlarged images show somata from pyramidal neurons in L2/3 and L5 and neurons in L4. Graphs for soma size in L2/3 to L5 PtenT366A/T366A and wild-type neurons at P14 and P42, respectively. (D and E) Analysis of soma size in dentate gyrus neurons at P14 (D) and at P42 (E) in PtenT366A/T366A and wild-type mice. Each dot in graphs accounts for one cell. Data shown as average ± SEM. Data from three brains each genotype, six sections per brain. Statistical analysis with one-way ANOVA, unpaired t-test for dentate gyrus, ***P < 0.001. Analysis details are provided in Supplementary Table 5. Scale bars = 100 µm, enlarged images in B 20 µm, in C–E, 50 µm.

