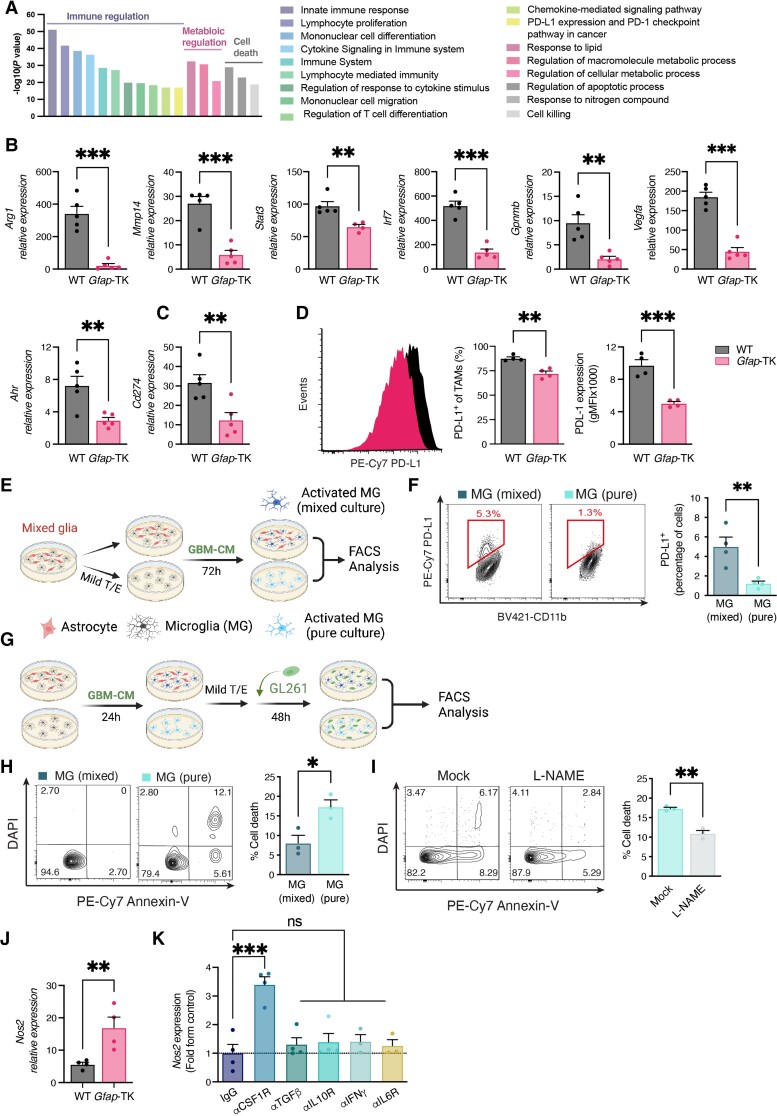
Figure 4.
TAA ablation attenuates TAM activation. (A–D) Functional analysis of TAMs (CD11b+CD45+) isolated from GCV-treated wild-type (WT) and Gfap-TK GL261-implanted mice (as in Fig. 3) 17 days after tumour implantation. (A) Pathway enrichment analysis of differentially expressed genes (at least 2-fold, Padj < 0.05) as detected by Nanostring (Supplementary Fig. 5A). (B and C) qPCR analysis of Arg1, Ahr, Stat3, Irf7, Gpnmb, Vegfa, Mmp14 and Cd274 expression in FACS-sorted TAMs; expression normalized to Ppia. Data are representative of three independent experiments (n = 4 biologically independent samples, pool of two mice per sample). (D) PD-L1 expression in TAMs. Representative flow cytometry plots from each group are shown on the left and quantification analyses of the percentage of PD-L1+ TAMs and PD-L1 expression (geometric mean fluorescence intensity, gMFI) is on the right. Data are representative of three independent experiments (n = 4 biologically independent samples, pool of two mice per sample). (E and F) Mixed glial cultures were treated with mild trypsin/EDTA to remove the astrocyte monolayer leaving only the microglia attached to the plate, or were left untreated. Cultures were then treated with GL261 conditioned media (GBM-CM) for 72 h. (F) Representative flow cytometry plots of microglial (gated as CD11b+ cells) PD-L1 expression from each group are shown on the left, and quantification analyses of the percentage of PD-L1+ microglial cells are on the right (n = 4 biologically independent experiments). (G) Mixed glia and microglial cultures were prepared as in E and treated with GBM-CM for 24 h. Microglial cultures were then isolated with mild trypsin/EDTA and co-cultured with GFP+-GL261 cells for 48 h. The viability of GFP-gated GL261 cells was then determined by Annexin-V assay. (H) Representative flow cytometry plots of GFP-gated GL261 cells from each group are shown on the left, and quantification analyses of cell death are on the right (n = 4 biologically independent experiments). (I) Microglial cultures were pretreated with L-NAME (2 mM) before co-incubation with GL261 cells, and glioma viability was analysed as in H. n = 3 biologically independent experiments. (J) qPCR analysis of Nos2 expression in FACS-sorted microglial cells (CD11b+CD45dim) isolated from GCV-treated wild-type and Gfap-TK GBM-bearing mice, as in Fig. 1; expression normalized to Ppia. Data are representative of three independent experiments (n = 3 biologically independent samples, pool of two mice per sample). (K) Mixed glial cells were treated with the indicated blocking antibodies or appropriate isotype controls (25 μg/ml), and then activated with GBM-CM. Microglia were isolated as in E, and microglial expression of Nos2 was determined by qPCR relative to Ppia (n = 5 biologically independent experiments). Data are shown as mean ± SEM. P-values were determined by two-sided Student’s t-tests (A–J) and one-way ANOVA, followed by Fisher’s LSD post hoc analysis (K) or *P < 0.05, **P < 0.01, ***P < 0.001; ns = not significant.

