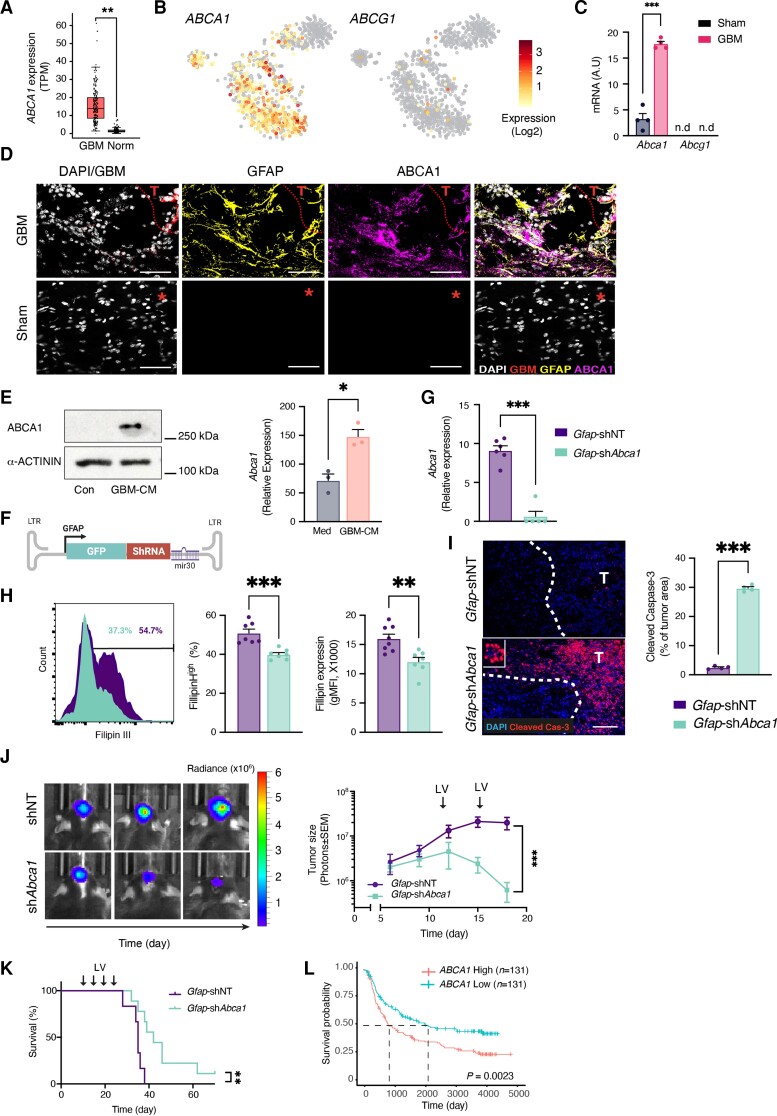
Figure 6.
Astrocytic expression of ABCA1 regulates glioma cholesterol levels and tumour progression. (A) Box plot analysis of TCGA gene expression for ABCA1 in normal (Norm; n = 207) or GBM patients (n = 163). n represents the number of patients per group. (B) Heat map overly of the scRNAseq gene expression intensity of ABCA1, and ABCG1 in TAAs from GBM patients42 (astrocyte cluster as in Supplementary Fig. 3A). (C) qPCR analysis of Abca1 expression in Ribotag-isolated astrocytes GBM-bearing mice, as in Fig. 2. (D) Representative immunofluorescence images of sham-injected or GL261-bearing mice stained for ABCA1 (purple), GFAP (reactive astrocytes, yellow), GBM, (GFP+-GL261, red) and nuclei (DAPI, white); asterisk indicates the injection coordinates in sham, scale bars = 35 μm (n = 2 biologically independent experiments, four mice per group). (E) Representative immunoblot (left) and quantitative reverse transcription (right) analyses comparing ABCA1 levels in primary astrocytes treated with GBM-CM for 24 h (immunoblot) or 6 h (quantitative reverse transcription; expression normalized to Ppia) (n = 3 biologically independent experiments). (F) Schematic map of the astrocyte-specific shRNA lentiviral vector. (G–K) Intracranially injection of astrocyte-specific shAbca1 lentivirus attenuates GBM progressions. Non-targeting (Gfap-shNT) or Abca1-targeting (Gfap-shAbca1) astrocyte-specific lentiviruses were injected into the TME of GL261-bearing mice every 5 days (as indicated) starting 9 days after tumour implantation. (G) Quantitative reverse transcription analysis of FACS-sorted GFP+-astrocytes for Abca1 on Day 18; expression normalized to Ppia. Data are representative of two independent experiments (n = 4 biologically independent samples). (H) Representative flow cytometry plots of Filipin III staining in tdTomato+-expression GL261 cells from each group are shown on the left and quantification analyses of the percentage of Filipin+ GL261 cells and filipin intensity (gMFI) are on the right. Data are representative of two independent experiments (n = 4 biologically independent samples per group). (I) Representative immunofluorescence images of cleaved caspase-3 (red) and nuclei (DAPI, blue) 10 days after lentivirus injection are shown on the left and quantification is on the right. T indicates the tumour. Data are representative of two independent experiments (n = 4 biologically independent samples per group). (J) Representative images of GL261-derived bioluminescence from each group are shown on the left and quantification of tumour size on the right. Data are representative of three independent experiments with n = 6 mice/group. (K) Kaplan–Meier curves assessing overall survival of these groups. Data are representative of two independent experiments with n = 6 mice/group. (L) Kaplan–Meier curves assess the overall survival of GBM patients on the basis of ABCA1 expression; n represents the number of patients per group. Data are shown as mean ± SEM. P-values were determined by two-sided Student’s t-tests (A, C, E, G, H and I), two-way ANOVA (J) or log rank (Mantel–Cox) test (K and L). *P < 0.05, **P < 0.01, ***P < 0.001. n.d. = not detected.

