. 2023 Feb 20;29(11):2066–2074. doi: 10.1158/1078-0432.CCR-22-2765

Figure 4.

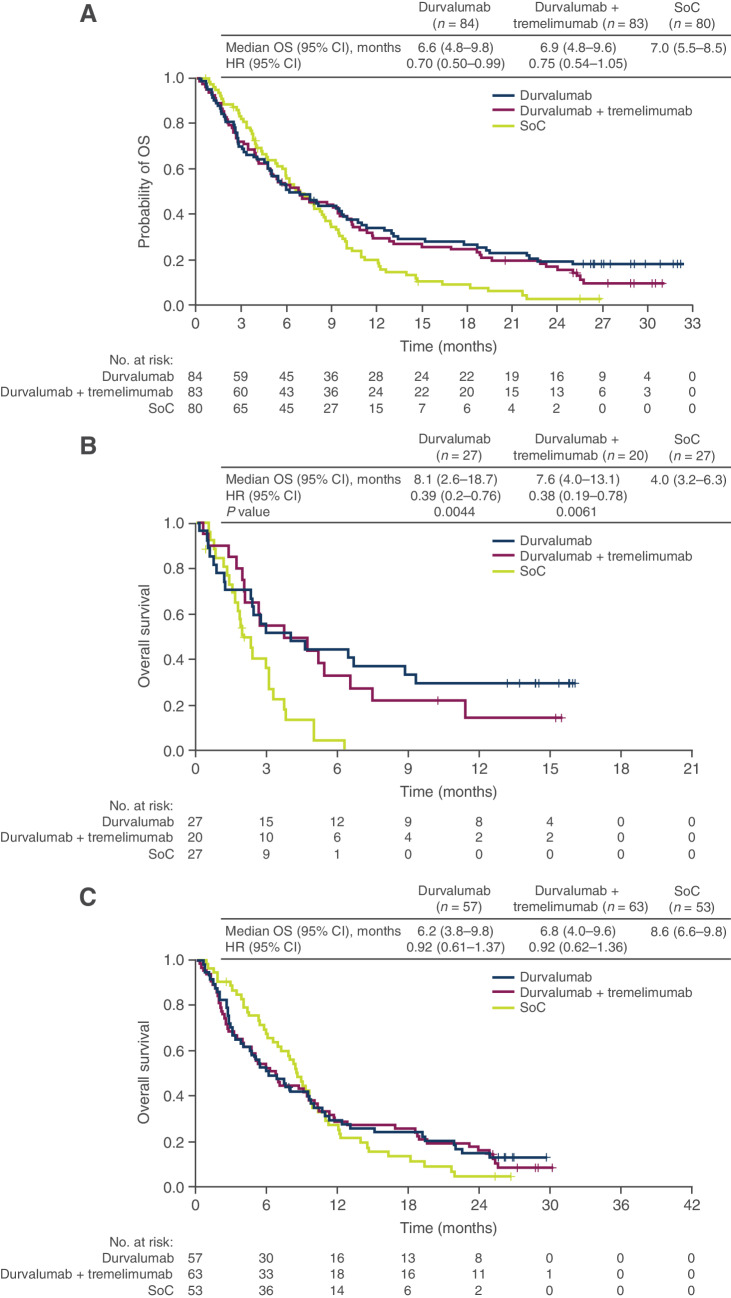
Figure 4. Kaplan–Meier plot of OS in the durvalumab monotherapy, durvalumab plus tremelimumab and SoC treatment arms in the bTMB-evaluable population (A), bTMB-high subgroup (B), and bTMB-low subgroup (C). HRs were calculated as durvalumab with/without tremelimumab versus chemotherapy. bTMB, blood plasma tumor mutational burden; CI, confidence interval; HR, hazard ratio; OS, overall survival; SoC, standard of care.

Kaplan–Meier plot of OS in the durvalumab monotherapy, durvalumab plus tremelimumab, and SoC treatment arms in the bTMB-evaluable population (A), bTMB-high subgroup (B), and bTMB-low subgroup (C). HRs were calculated as durvalumab with/without tremelimumab versus chemotherapy. bTMB, blood plasma tumor mutational burden; CI, confidence interval; HR, hazard ratio; OS, overall survival; SoC, standard of care.