. 2023 Mar 16;29(11):2052–2065. doi: 10.1158/1078-0432.CCR-22-3642

Figure 3.

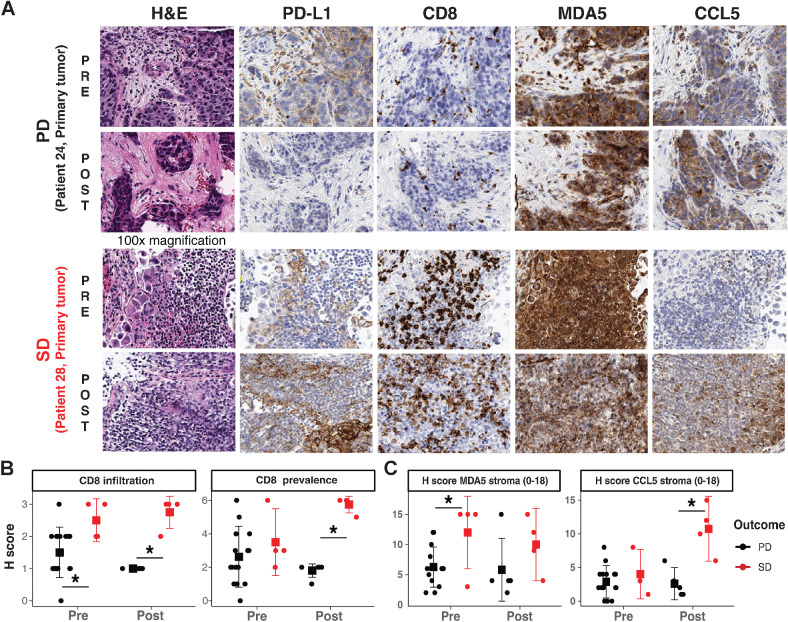
Figure 3. IHC reveals immune recruitment in tumors is associated with SD. A, Representative IHC staining of PD and SD tumors in pretreatment and posttreatment timepoint. B, IHC H-scores of CD8 infiltration status and prevalence in PD and SD tumors. C, IHC histology scores (H scores) of stromal MDA5 levels, and stromal CCL5 levels in PD and SD tumors. Statistical significance were tested with log-transformed robust linear mixed-effects models; SGPVs were used to determine if there was significant evidence of a difference where the null interval was set at ± 5% difference in regression estimates. *SGPV = 0; there were no SGPVs = 1 (i.e., no evidence of approximate equivalence). Error bars represent means ± Gini mean difference (a nonparametric measure of dispersion/spread).

IHC reveals immune recruitment in tumors is associated with SD. A, Representative IHC staining of PD and SD tumors in pretreatment and posttreatment timepoint. B, IHC H-scores of CD8 infiltration status and prevalence in PD and SD tumors. C, IHC histology scores (H scores) of stromal MDA5 levels, and stromal CCL5 levels in PD and SD tumors. Statistical significance was tested with log-transformed robust linear mixed-effects models; SGPVs were used to determine if there was significant evidence of a difference where the null interval was set at ± 5% difference in regression estimates. *SGPV = 0; there were no SGPVs = 1 (i.e., no evidence of approximate equivalence). Error bars represent means ± Gini mean difference (a nonparametric measure of dispersion/spread).