. 2023 Mar 3;21(6):614–627. doi: 10.1158/1541-7786.MCR-22-0370

Figure 2.

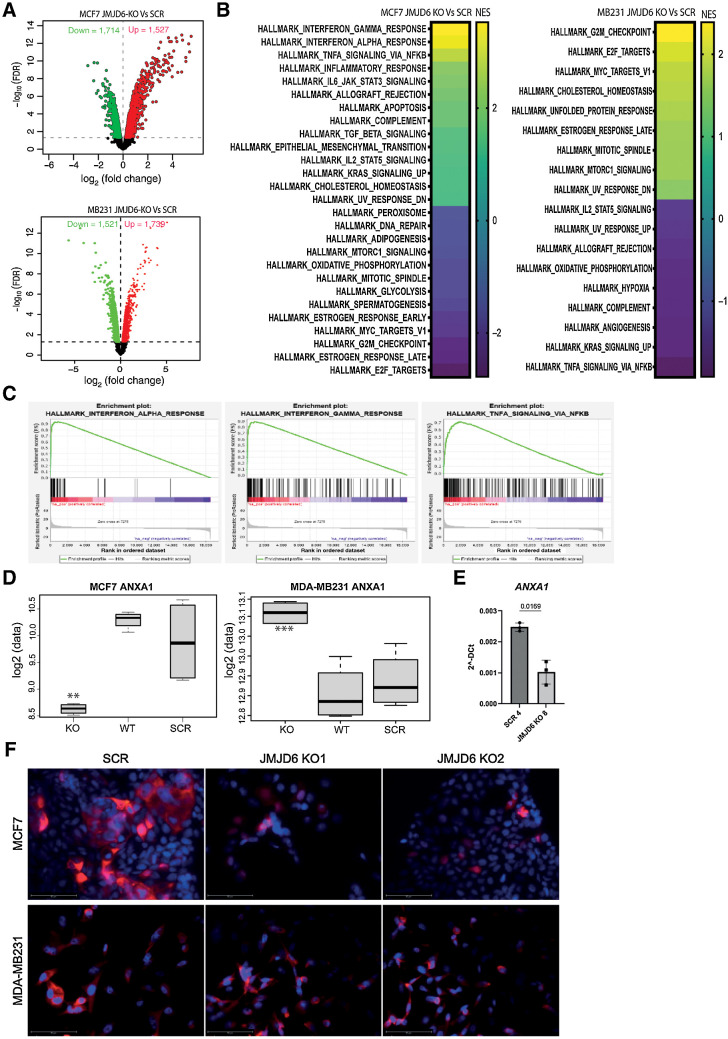
Figure 2. Transcriptome profile of scramble and JMJD6 KO MCF7 and MDA-MB231 cells. A, Volcano plot showing statistical significance values against fold-change and highlighting the most upregulated (red) and downregulated (green) genes between JMJD6 KO and scramble MCF7 (top), and MDA-MB231 (bottom) cells. B, GSEA analysis of the most significantly up- or downregulated hallmark pathways in JMJD6 KO MCF7 (left) and MDA-MB231 (right) cells compared with scramble control. C, GSEA plots showing enrichment of genes associated with inflammatory pathways in JMJD6 KO MCF7 cells compared with scramble control. Significant GSEA pathways are defined on the basis of FDR < 0.05. D, mRNA expression of ANXA1 in WT, scramble and JMJD6 KO MCF7 and MDA-MB231 cells. t test was performed between JMJD6 KO MCF7 and scramble cells, and between JMJD6 KO and scramble cells. **, P < 0.01; ***, P < 0.001. E, Real Time PCR showing the levels of ANXA1 in control and JMJD6 KO clones. Statistical significance was calculated by paired two-tailed t test. F, Immunofluorescence staining showing the expression of ANXA1 (red) in scramble or JMJD6 KO MCF7 and MDA-MB231 cell clones. Nuclei were stained with DAPI (blue), bars = 50 μmol/L.

Transcriptome profile of scramble and JMJD6 KO MCF7 and MDA-MB231 cells. A, Volcano plot showing statistical significance values against fold-change and highlighting the most upregulated (red) and downregulated (green) genes between JMJD6 KO and scramble MCF7 (top), and MDA-MB231 (bottom) cells. B, GSEA analysis of the most significantly up- or downregulated hallmark pathways in JMJD6 KO MCF7 (left) and MDA-MB231 (right) cells compared with scramble control. C, GSEA plots showing enrichment of genes associated with inflammatory pathways in JMJD6 KO MCF7 cells compared with scramble control. Significant GSEA pathways are defined on the basis of FDR < 0.05. D, mRNA expression of ANXA1 in WT, scramble and JMJD6 KO MCF7 and MDA-MB231 cells. t test was performed between JMJD6 KO MCF7 and scramble cells, and between JMJD6 KO and scramble cells. **, P < 0.01; ***, P < 0.001. E, Real Time PCR showing the levels of ANXA1 in control and JMJD6 KO clones. Statistical significance was calculated by paired two-tailed t test. F, Immunofluorescence staining showing the expression of ANXA1 (red) in scramble or JMJD6 KO MCF7 and MDA-MB231 cell clones. Nuclei were stained with DAPI (blue), bars = 50 μmol/L.