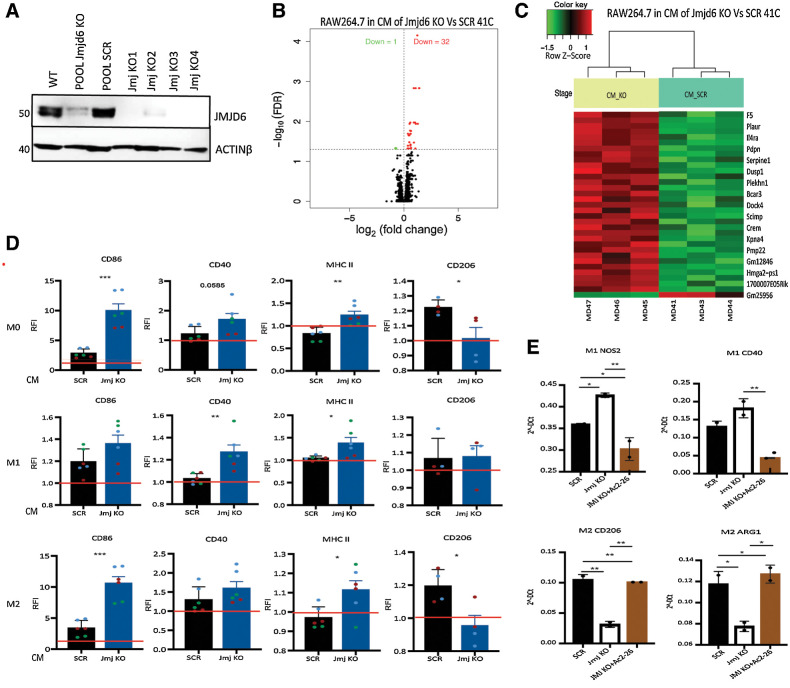
Figure 5.
ANXA1 released by tumor cells affects macrophage differentiation in vitro. A, Western blot showing the expression of JMJD6 in PyMT-41C cells in different KO clones. Actin-β was used as housekeeping protein expression. B, Volcano plot of statistical significance against fold-change between RAW264.7 macrophages cultured in CM of Jmjd6 KO or scramble PyMT-41C cells showing the significantly upregulated (32, red) and downregulated (1, green) genes. C, Heatmap shows the degree of clustering between biological replicates and distinct pattern of gene expression level between RAW264.7 macrophages cultured in CM of Jmjd6 KO (yellow) and scramble PyMT-41C cells (light green) cells. Color coding green to red shows the z-score value from -1.5 to 1. D, Relative fluorescence intensity (RFI) plots showing the expression level of M1 and M2 markers in M0, M1, and M2 BMDMs in CM of scramble and Jmjd6 KO PyMT-41C cells. Data were normalized on macrophages cultured without CM (red bar). Datapoints show the biological replicates of three independent experiments (green, blue and red) with two biological replicates in each experiment. Error bars show the SEM. P value is calculated with one-way ANOVA, Tukey multiple comparison test. E, Real-time PCR showing the expression of M1 markers (Cd40 and Nos2) and M2 markers (Cd206 and Arg1) in M1 and M2 differentiated BMDMs cultured in CM of scramble and Jmjd6 KO PyMT-41C cells, with or without the ANXA1 mimetic peptide Ac2–26.

