. 2023 Mar 3;21(6):614–627. doi: 10.1158/1541-7786.MCR-22-0370

Figure 6.

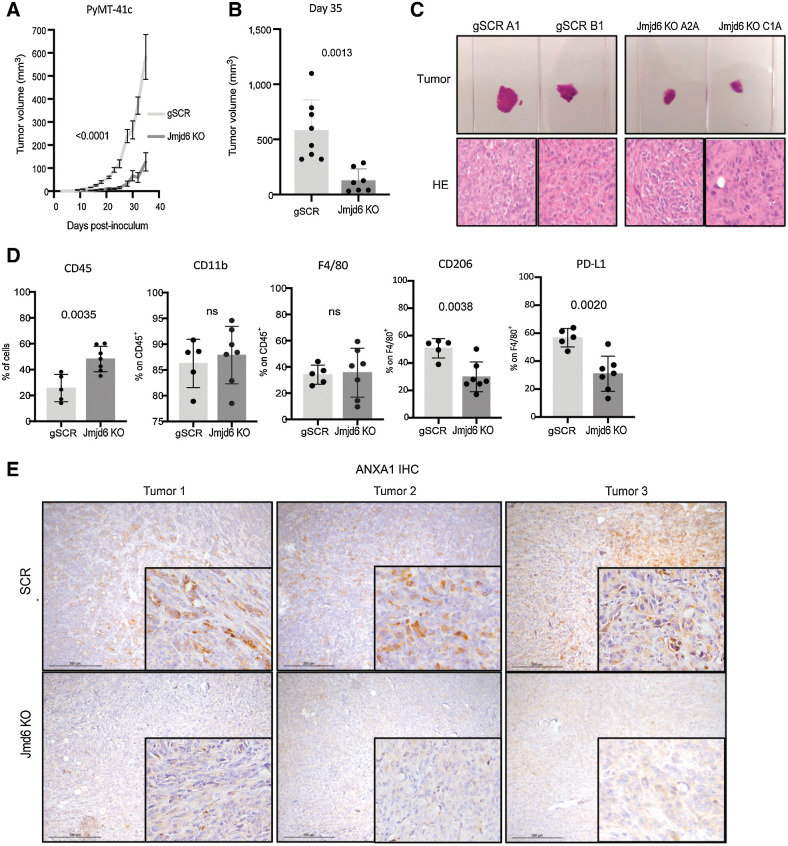
Figure 6. Tumor cell JMJD6 supports M2 macrophage differentiation and tumor growth in breast cancer mouse model. A, Tumor growth after inoculation of scramble (light gray) and Jmjd6 KO (dark gray) PyMT-41C cells in C57BL/6 mice. P value is calculated with two-way ANOVA, Sidak multiple comparison test. Error bars shows S.D. B, Tumor volume of scramble (light gray) and Jmjd6 KO (dark gray) PyMT-41C cells in C57BL/6 mice at the experimental endpoint of 35 days. P value is calculated with two-way ANOVA, Sidak multiple comparison test. Each dot represents a different mouse. Error bars shows SD among samples. C, Top, Representative images of two scramble PyMT-41C cells-derived tumors (clone A1 and clone B1) and two Jmjd6-KO PyMT-41C cells-derived tumors (clone A2A and clone C1A). Below, H&E staining of the different tumors. D, Percentage of CD45+ immune cells, CD11b+ myeloid cells, F4/80+ monocytes, macrophages, CD206+ M2-like macrophages over F4/80+ macrophages and PD-L1+ immunosuppressive macrophages over F4/80+ macrophages in tumors derived from scramble or Jmjd6 KO PyMT-41C cells. P value is calculated with unpaired t test. Each dot represents a different mouse. Error bars show SD among samples. E, IHC analysis of ANXA1 expression in tumors derived from scramble and Jmjd6 KO PyMT-41C cells injected in C57BL/6 mice.

Tumor cell JMJD6 supports M2 macrophage differentiation and tumor growth in breast cancer mouse model. A, Tumor growth after inoculation of scramble (light gray) and Jmjd6 KO (dark gray) PyMT-41C cells in C57BL/6 mice. P value is calculated with two-way ANOVA, Sidak multiple comparison test. Error bars shows S.D. B, Tumor volume of scramble (light gray) and Jmjd6 KO (dark gray) PyMT-41C cells in C57BL/6 mice at the experimental endpoint of 35 days. P value is calculated with two-way ANOVA, Sidak multiple comparison test. Each dot represents a different mouse. Error bars shows SD among samples. C, Top, Representative images of two scramble PyMT-41C cells-derived tumors (clone A1 and clone B1) and two Jmjd6-KO PyMT-41C cells-derived tumors (clone A2A and clone C1A). Below, H&E staining of the different tumors. D, Percentage of CD45+ immune cells, CD11b+ myeloid cells, F4/80+ monocytes, macrophages, CD206+ M2-like macrophages over F4/80+ macrophages and PD-L1+ immunosuppressive macrophages over F4/80+ macrophages in tumors derived from scramble or Jmjd6 KO PyMT-41C cells. P value is calculated with unpaired t test. Each dot represents a different mouse. Error bars show SD among samples. E, IHC analysis of ANXA1 expression in tumors derived from scramble and Jmjd6 KO PyMT-41C cells injected in C57BL/6 mice.