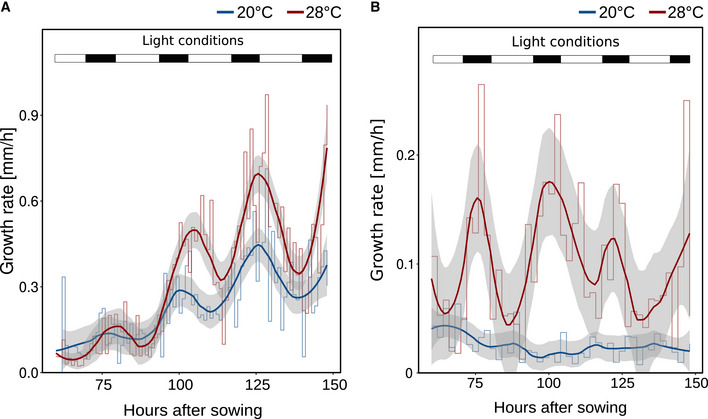
Figure EV1. Growth dynamics in response to different temperatures.

-
A, BGrowth rates of seedling (A) roots and (B) hypocotyls between days 2 and 7 were assessed by hourly and 2‐hourly infra‐red real‐time imaging, respectively. Mean growth rates are shown as step‐wise lines (n = 7–8) that were fitted with a “loess” smoothing function shown as solid lines and the respective 95% confidence intervals are shown as gray ribbons. Long‐day lighting is schematically depicted by white (light) and black (dark) bars on the top.
Source data are available online for this figure.
