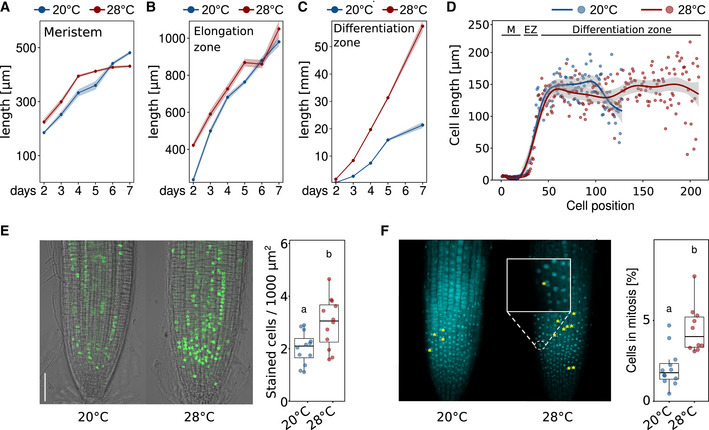
Figure 3. Temperature effects on root zones, cell size, cell number, and cell proliferation.

-
A–C(A) Meristem, (B) Elongation zone, and (C) Differentiation zone. (A–C) Solid lines and points show mean root zone lengths with half‐transparent ribbons denoting SEM (n = 5–7 individual roots).
-
DCell lengths in consecutive cortex cell files of 5‐day‐old seedlings starting from the root tip (quiescent center = position 1) spanning the meristem (M), elongation zone (EZ), and differentiation zone up to the root–shoot junction. Individual dots represent mean cell lengths (n = 8), and lines show a fitted smoothing function (generalized additive models) with the 95% confidence intervals shown in light gray ribbons.
-
EEdU staining marks cells that were in S‐phase during the 1 h incubation time prior to microscopic imaging. Scale bar = 50 μm, n = 12.
-
FDAPI staining was used to identify cells currently in mitosis (examples are highlighted by yellow asterisks). Scale bar = 50 μm, n = 10–11. The data are representative of two (A–D) or three (E, F) independent experiments.
