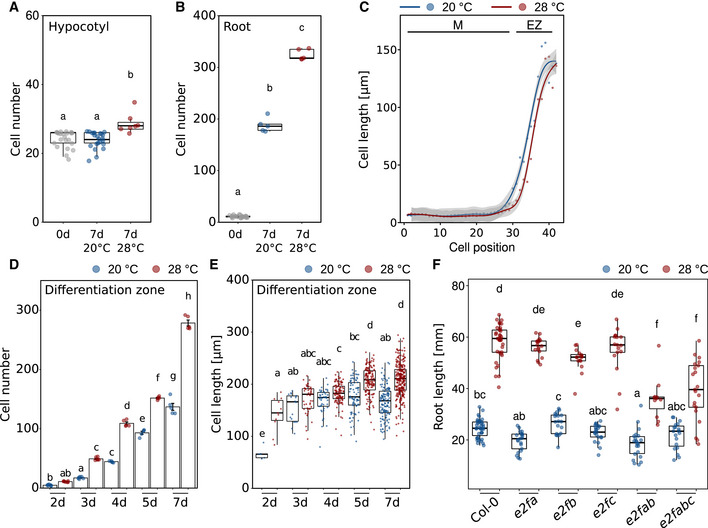
Figure EV3. Changes in root and shoot cell numbers from mature embryos to 7‐day‐old seedlings.

-
A, BNumber of cells in a consecutive cell file of (A) hypocotyls and (B) roots of mature embryos prior to germination (0 days) and in 7‐day‐old seedlings grown at 20 or 28°C.
-
CClose‐up view of the first 43 cells comprising meristem (M) and elongation zone (EZ) of data shown in Fig 3D.
-
DTotal number of cells in a longitudinal cortex cell file of the differentiation zone between days 2 and 7 after sowing. Barplots show mean values, error bars indicate SEM. Individual data points are plotted as colored dots (n = 5–7).
-
EMean lengths of all cells in a consecutive cell file of the differentiation zone measured in 5–7 individual roots. Number of cells ranges from n = 5 (2 days, 20°C) to n = 272 (7 days, 28°C).
-
FTemperature‐induced root elongation in 7‐day‐old wild‐type, single‐, and higher‐order e2f mutants (n = 11–39). Boxplots show medians, interquartile ranges, and min–max values with individual data points superimposed as colored dots. Different letters denote statistical differences at P < 0.05 as assessed by one‐way ANOVA (A, B) or two‐way ANOVA (D–F) and Tukey's HSD post hoc test.
Source data are available online for this figure.
