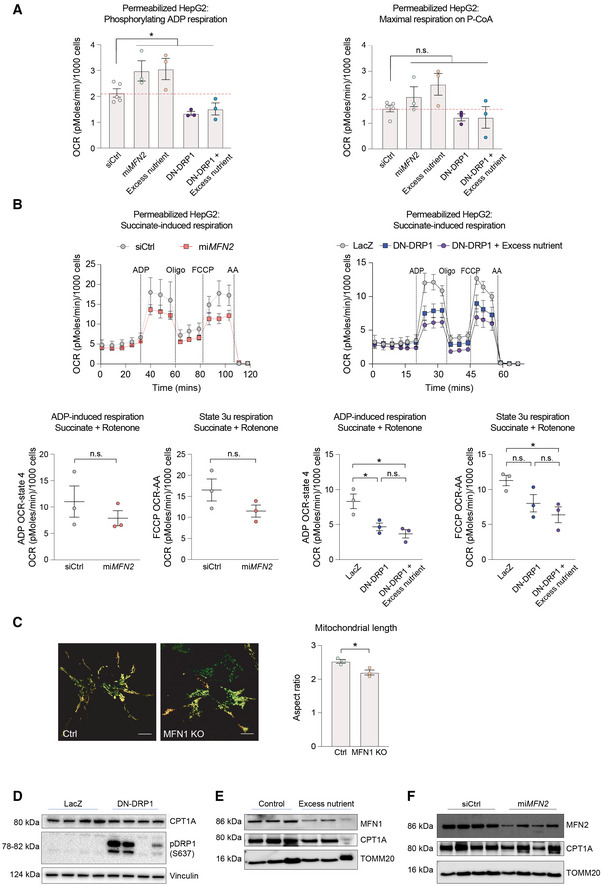
Figure EV1. Genetic perturbation of mitochondrial morphology has selective effects on mitochondrial substrate oxidation.

-
AQuantification of phosphorylating ADP and maximal respiration induced by palmitoyl‐CoA in permeabilized HepG2 cells. n = 5 independent biological replicates for siCtrl and n = 3 independent biological replicates with six technical repeats for all other perturbations. Data represent means ± SEM, t‐test. *P < 0.05.
-
BSuccinate‐induced respiration in permeabilized HepG2 cells. n = 3 biological replicates with six technical repeats. Data represent means ± SEM, t‐test. *P < 0.05.
-
CRepresentative images of MFN1 KO HepG2 cells and quantification of mitochondrial length. Scale bar: 10 μm. Data represent means ± SEM, n = 3, t‐test. *P < 0.05.
-
D–FQuantification of CPT1 protein expression in HepG2 cells following expression of DN‐DRP1 (D), excess nutrient treatment (E), or miMFN2 (F).
