-
A
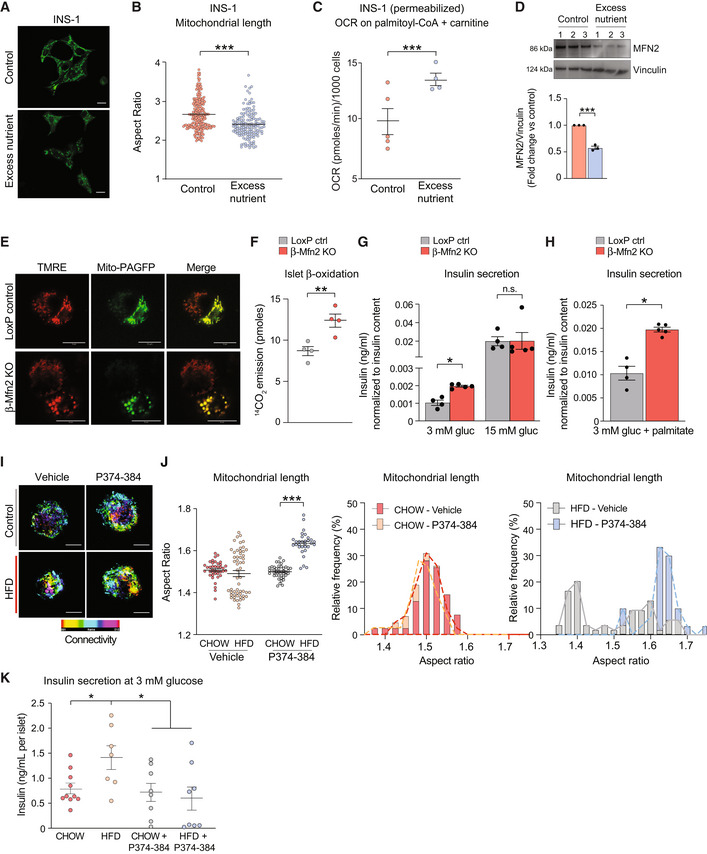
Representative confocal images of mitochondria in INS‐1 cells cultured under control or excess nutrient conditions (20 mM glucose and 0.4 mM palmitate) and subsequently stained with MitoTracker Green (green). Scale bar: 10 μm.
-
B
Quantification of mitochondrial length by aspect ratio in INS‐1 cells under control and excess nutrient conditions as in (A). Data represent means ± SEM, n = 219 cells from control and n = 148 cells from excess nutrient condition were analyzed, t‐test. ***P < 0.001.
-
C
FAO assessed by OCR stimulated by palmitoyl‐CoA and carnitine in permeabilized INS‐1 in the presence of ADP. Data represent means ± SEM, n = 4 independent biological replicates (six technical replicates each n), t‐test. ***P < 0.001.
-
D
MFN2 protein levels in INS‐1 cells cultured under control and excess nutrient conditions as in (A) assessed by western blotting. Vinculin serves as loading control. Protein lysates from n = 3 experiments were analyzed and quantified by ImageJ, data represent means ± SEM, t‐test. ***P < 0.001.
-
E
Representative confocal images of β‐cells (GFP positive) and non‐β‐cells (GFP negative) in dispersed islets from LoxP control and β‐Mfn2KO mice. Mitochondria are labeled with TMRE (red) and mito‐PAGFP (green) driven by the insulin promoter. Mitochondrial fragmentation is only evident in the β‐Mfn2KO samples. Scale bar: 10 μm.
-
F
FAO (β‐oxidation) in LoxP control and β‐Mfn2KO islets assessed by 14C‐CO2 production from 14C‐U‐labeled palmitate. Data represent means ± SEM, n = 4 mice per genotype with 100 islets analyzed per condition in each experiment. Data represent means ± SEM, t‐test. **P < 0.01.
-
G
Averaged insulin secretion values at nonstimulatory (3 mM) and stimulatory (15 mM) glucose concentrations in LoxP control and β‐Mfn2KO islets derived from n = 4 and n = 5 mice, respectively. Data represent means ± SEM, t‐test. *P < 0.05. n.s, nonsignificant.
-
H
Fatty acid‐stimulated insulin secretion in LoxP control and β‐Mfn2KO islets derived from n = 4 and n = 5 mice and stimulated with 0.4 mM palmitate and 3 mM glucose. Data represent means ± SEM, t‐test. *P < 0.05.
-
I
Confocal images of mitochondria in dispersed islets from CHOW‐ or HFD‐fed mice with or without the MFN2 agonist peptide MFN2‐TAT‐P374‐384 (P374‐384) to increase mitochondrial fusion (connectivity). Mitochondria are stained with GPR75 and connectivity and length are presented as maximum projections. Scale bar: 10 μm.
-
J
Quantification and distribution of mitochondrial length in response to vehicle or P374‐384 treatment of all islets derived from n = 4 CHOW‐ or HFD‐fed mice. Vehicle data are from n = 39 CHOW islets and n = 55 HFD islets. P374‐384 data are from n = 55 CHOW islets and n = 31 HFD islets. Data in the panel on the left represent means ± SEM, t‐test. ***P < 0.001.
-
K
Insulin secretion at nonstimulatory glucose concentrations in islets derived from n = 4 CHOW‐ or HFD‐fed wild‐type mice and subsequently treated with P374‐384. Data represent means ± SEM with 2–3 islets analyzed per mouse in each treatment group, t‐test. *P < 0.05.

