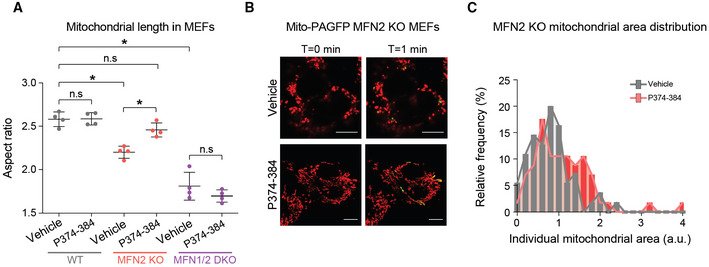
Figure EV3. Validation of the MFN2 agonist peptide MFN2‐TAT‐P374‐384.

-
AQuantification of mitochondrial length in response to P374‐384 treatment in mouse embryonic fibroblasts (MEFs) from the indicated genotypes. Data represent means ± SEM, n = 4 independent experiments with 30–50 cells analyzed per experiment, t‐test. *P < 0.05, n.s, nonsignificant.
-
BRepresentative confocal images of mitochondria in MFN2 KO MEFs treated with vehicle or P374‐384 and labeled with TMRE (red) and mito‐PAGFP (green). Enhanced fusion was identified by 2‐photon‐mediated photoconversion of PAGFP. Scale bar: 10 μm.
-
CQuantification of mitochondrial area in MFN2 KO MEFs treated with vehicle (gray) or P374‐384 (red). Data are from n = 4 independent experiments with 30–50 cells analyzed per experiment.
