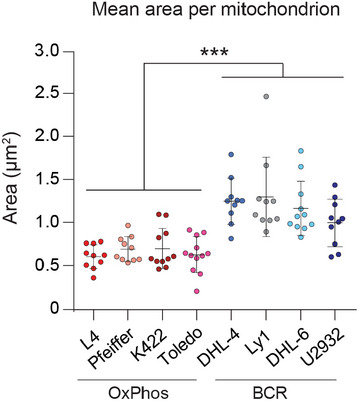
Figure EV4. Net increase in mitochondrial fragmentation in FAO prone OxPhos‐DLBCLs compared with BCR‐DLBCLs.

Average area of individual mitochondria in an expanded set of OxPhos‐ (red) and BCR‐DLBCL (blue) cell lines labeled as in Fig 3A. Data represent means ± SEM with n = 10 cells analyzed per cell line, unpaired t‐test with Welch's correction. ***P < 0.001.
