-
A, B
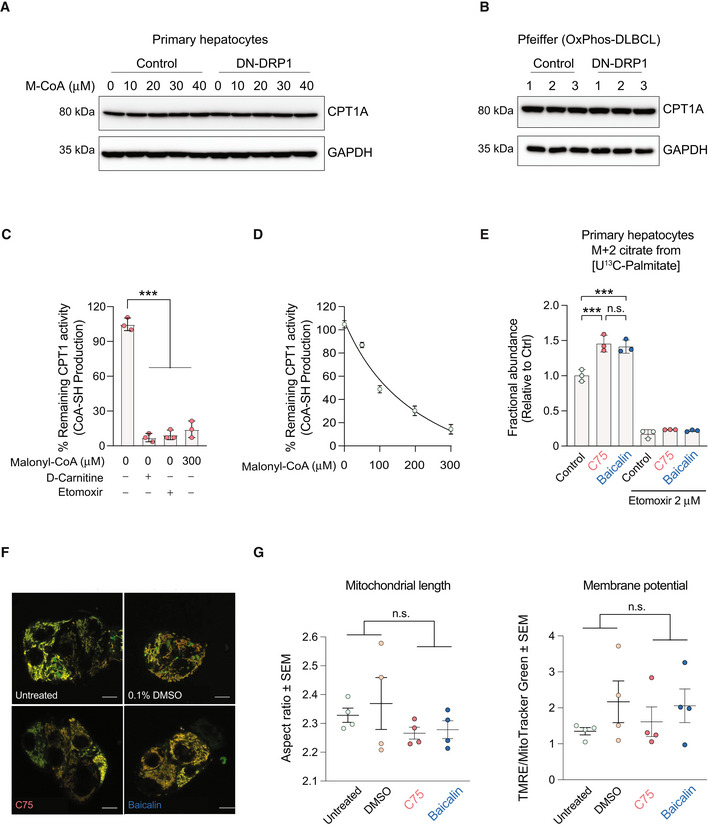
Quantification of CPT1 protein expression in primary hepatocytes (A) and the OxPhos‐DLBCL cell line Pfeiffer (B) following expression of DN‐DRP1 and varying concentrations of malonyl‐CoA.
-
C
CPT1 activity in the absence or presence of 2 μM etomoxir, 0 μM palmitoyl‐CoA, and 0 and 300 μM M‐CoA measured in mitochondria‐enriched heavy membrane fractions isolated from control primary hepatocytes. Enzyme activity was normalized to CPT1 protein levels in individual experiments. Data represent means ± SD, n = 3 individual experiments from primary hepatocytes, t‐test. ***P < 0.001.
-
D
Full titration curve of CPT1 activity in the presence of increasing malonyl‐CoA (M‐CoA) concentrations measured in mitochondria‐enriched heavy membrane fractions isolated from control primary mouse hepatocytes. Enzyme activity was normalized to CPT1 protein levels in individual experiments. Data represent means ± SD, n = 3.
-
E
Fractional abundance of m + 2 citrate from [U‐13C16] palmitate in primary hepatocytes treated with C75 and baicalin in the absence or presence of 2 μM etomoxir. Data represent means ± SD, n = 3 individual experiments from primary hepatocytes, t‐test. ***P < 0.001.
-
F, G
Representative confocal images (F) and quantification (G) of mitochondrial morphology and membrane potential of mitochondria in HepG2 cells treated with vehicle, C75, or baicalin and labeled with TMRE (red) and MitoTracker Green (green). Data represent means ± SEM, n = 4 independent biological replicates, 20 cells imaged per independent experiment, t‐test. Scale bar: 10 μm.

