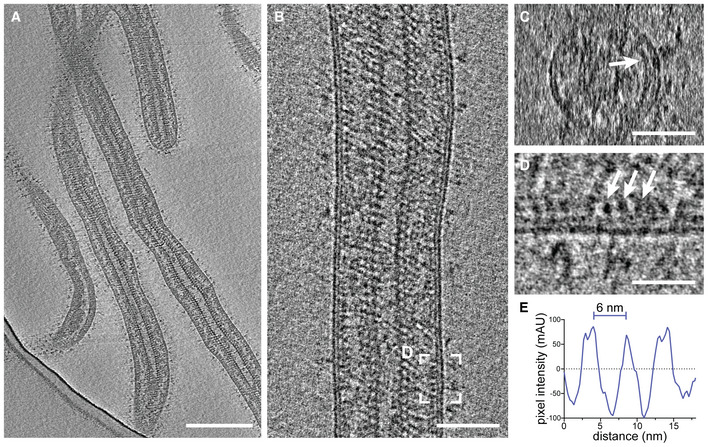
Figure EV2. Cryo‐electron tomography of purified and chemically fixed EBOV.

-
ASlices through a tomogram showing an overview of filamentous virions. Condensed and decorated nucleocapsids span the length of each virion.
-
B, CLongitudinal and transverse cross‐section, respectively, of a tomogram containing a filamentous EBOV.
-
CTransverse cross‐section of the virion shown in (B). The VP40 matrix adjacent to the inner membrane monolayer is highlighted by a white arrow.
-
DMagnified area highlighted in (B) showing a longitudinal cross‐section of the VP40 densities lining the inner membrane monolayer.
-
ELine profile determined adjacent to the inner monolayer of the virion shown in (B) showing the approximately 6 nm pitch of the VP40 matrix.
Data information: Scale bars: (A), (B): 200 nm, (C): 50 nm, (D): 20 nm.
Source data are available online for this figure.
