
Figure 5.
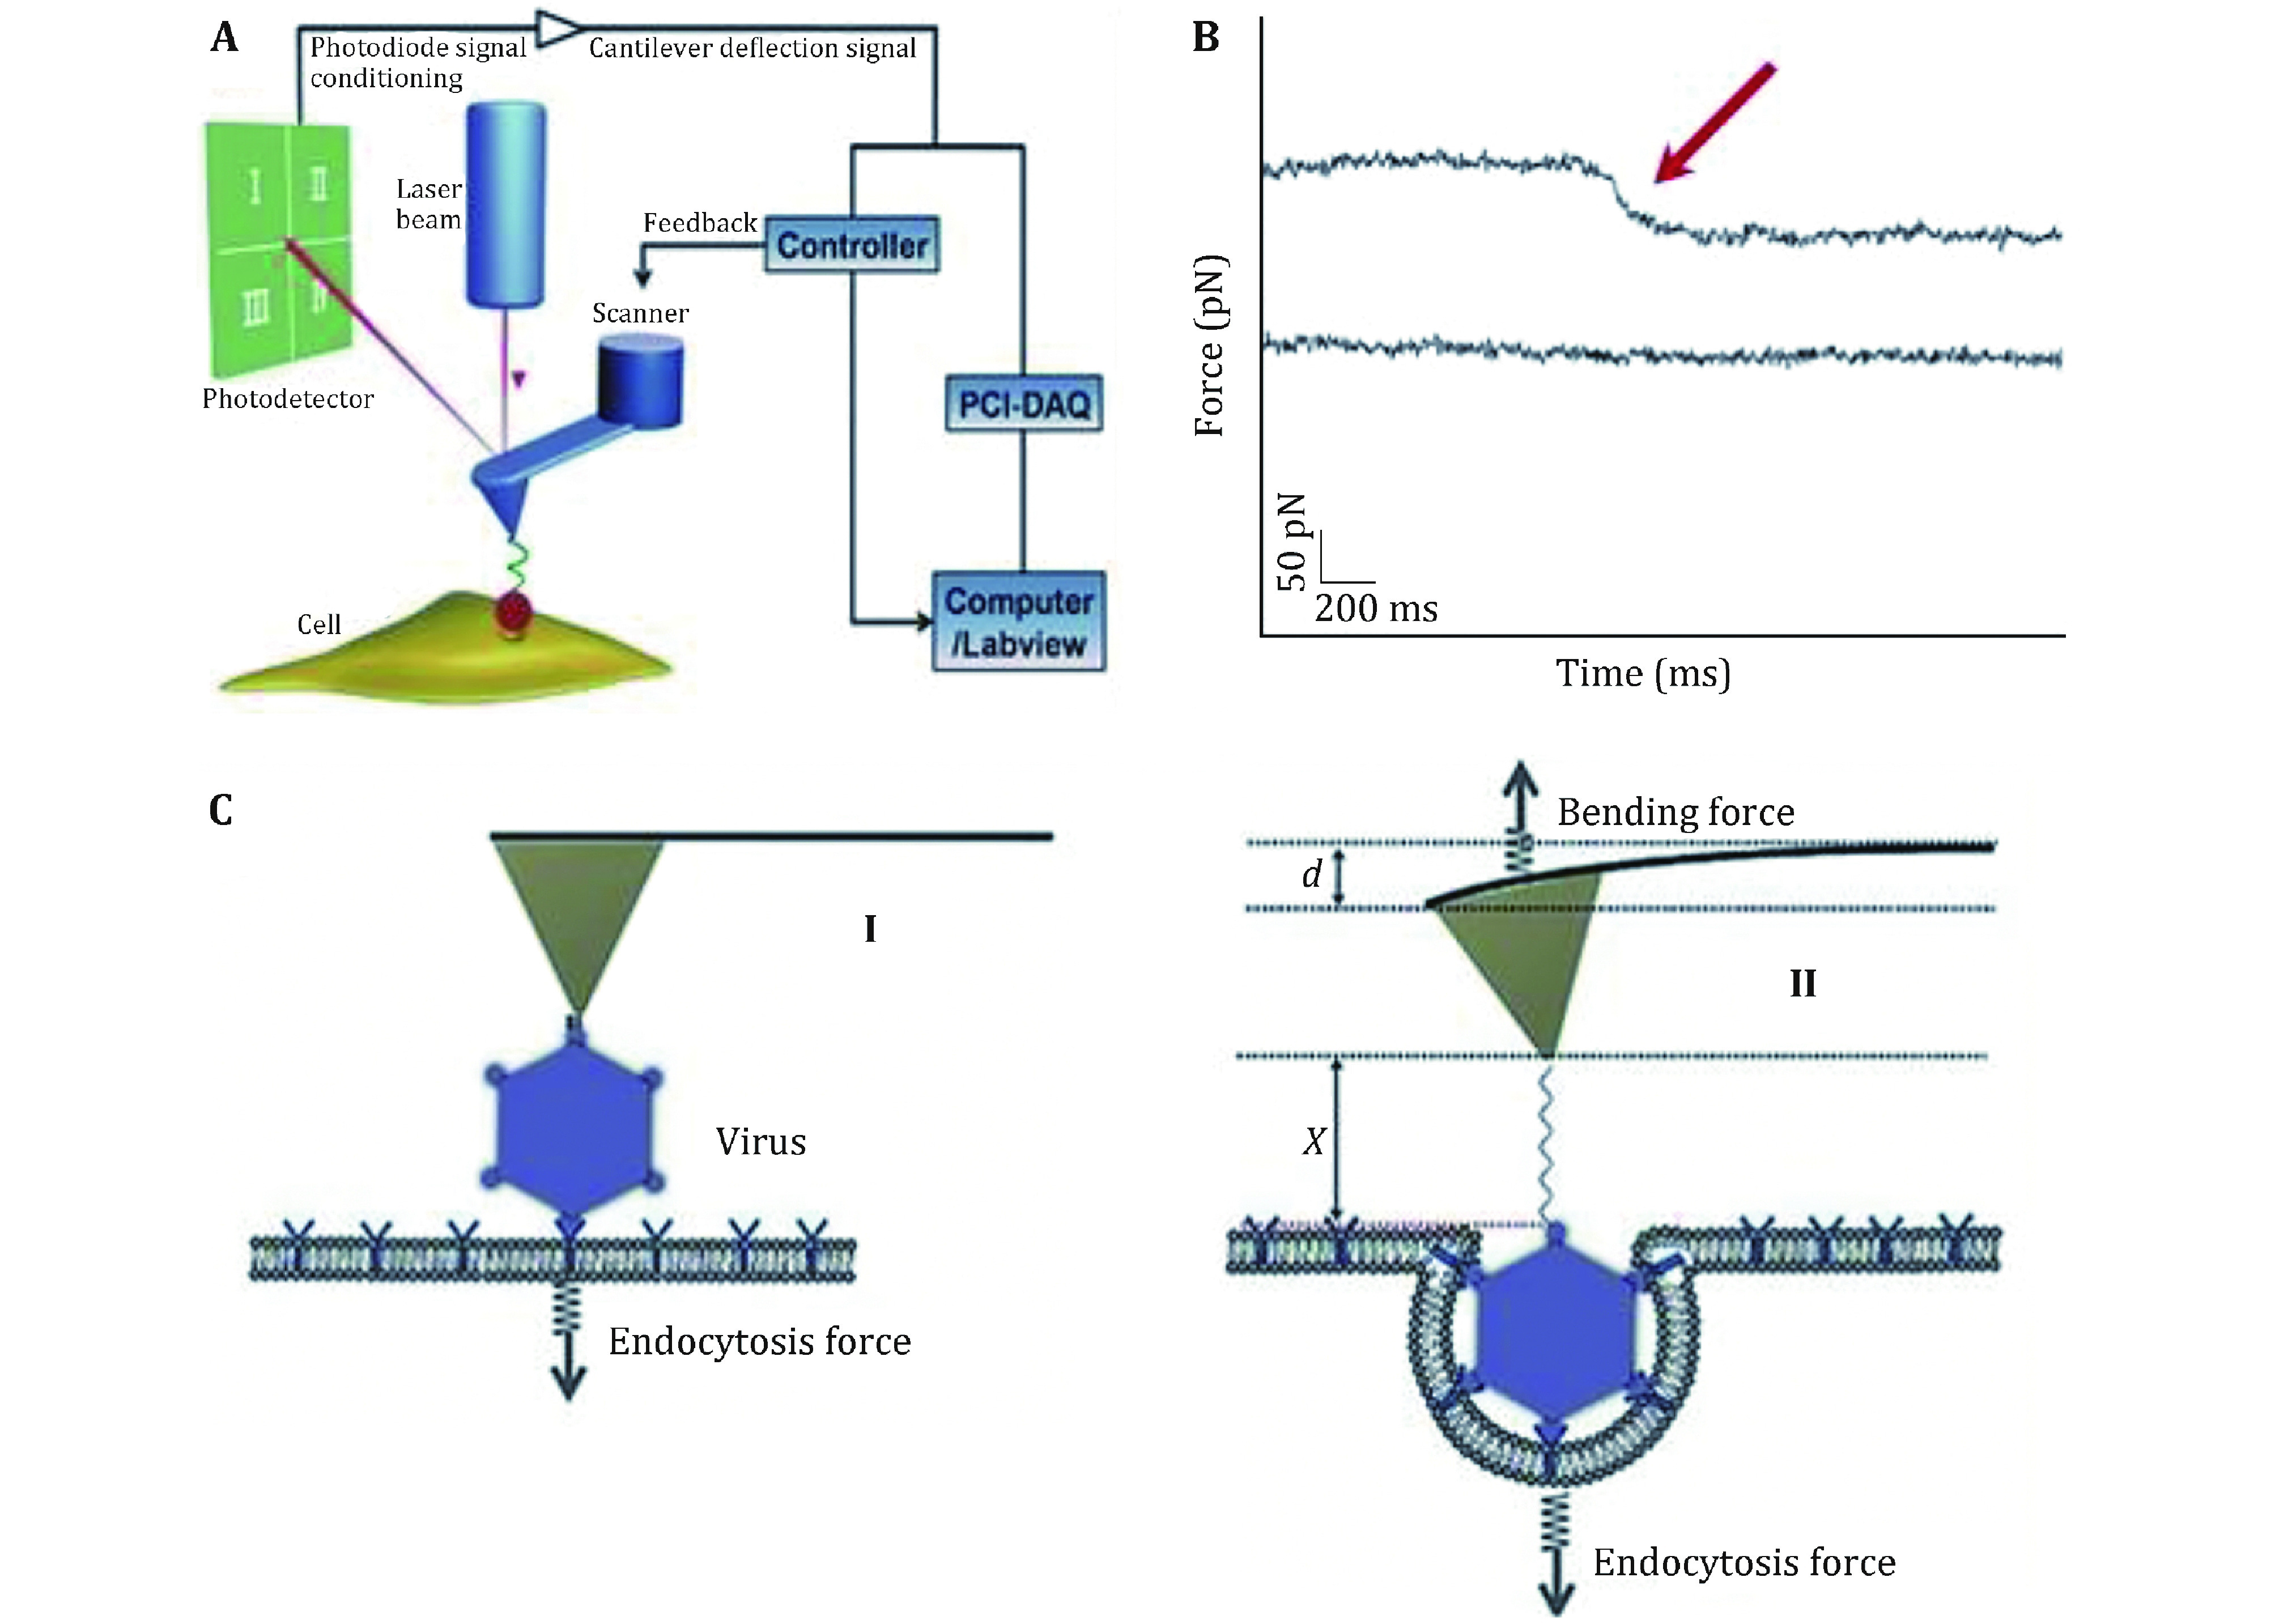
Schematic diagram of the force tracing technique for detecting the viral invagination. A Schematic diagram of the force tracing technique in constant position mode. The AFM tip modified with virions moves toward the cell surface and contacts the living cell at a constant position. B Typical force tracing curves (upper) of virus entry into the cell. No signals (lower) were observed when blocked with inhibitors. C The scheme of viral invagination via cell membranes. Reproduced from Pan et al. (2017) with permission of John Wiley & Sons Ltd