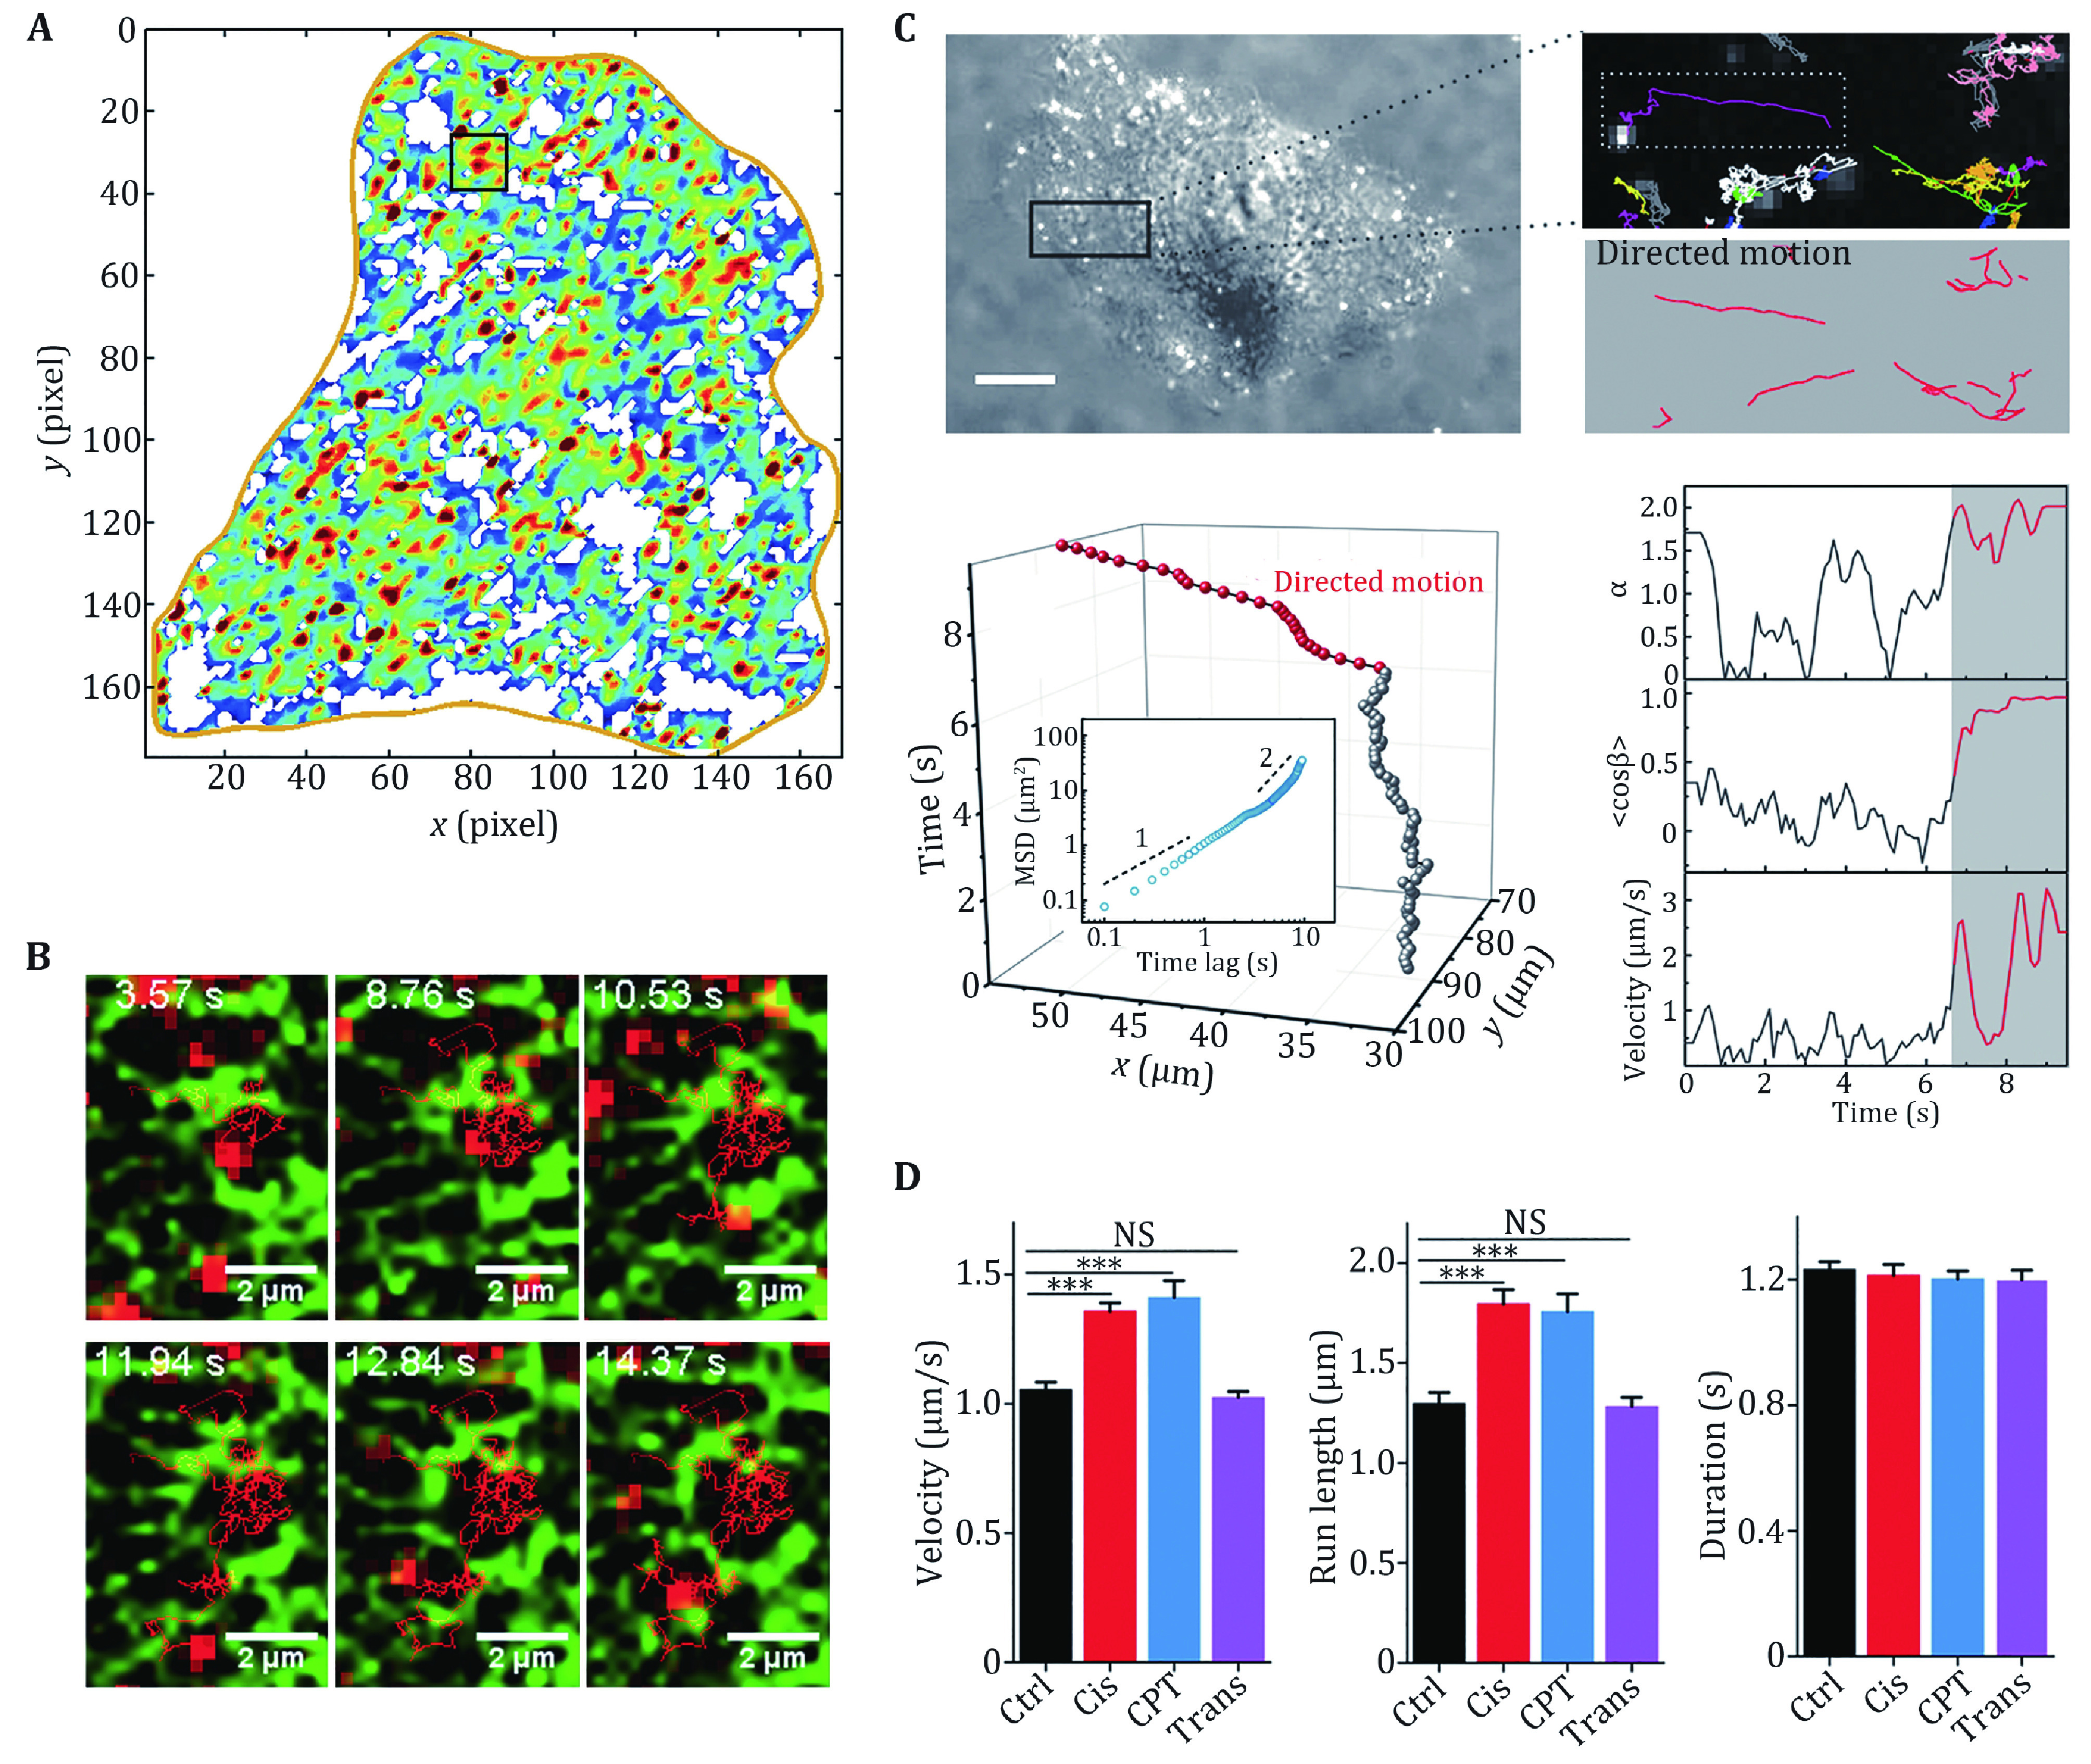
Figure 3.

Diffusive motion and direction motion in living cells. A Diffusion map of a A549 human lung cancer cell, in which the local diffusion coefficients from 0 to 0.3 μm2/s are indicated by the colours from blue to red. B Image series of a QD trajectory (red) overlaid with GFP-ER (green). Reprinted with permission from American Chemical Society (Li et al. 2015b). C The trajectories of endocytic vesicles are divided into directed (red) and diffusive motion (grey). D Dynamical parameters of the velocity, run length and duration of the directed motion in early apoptotic cells. Reprinted with permission from National Academy of Sciences (Li et al. 2018a)
