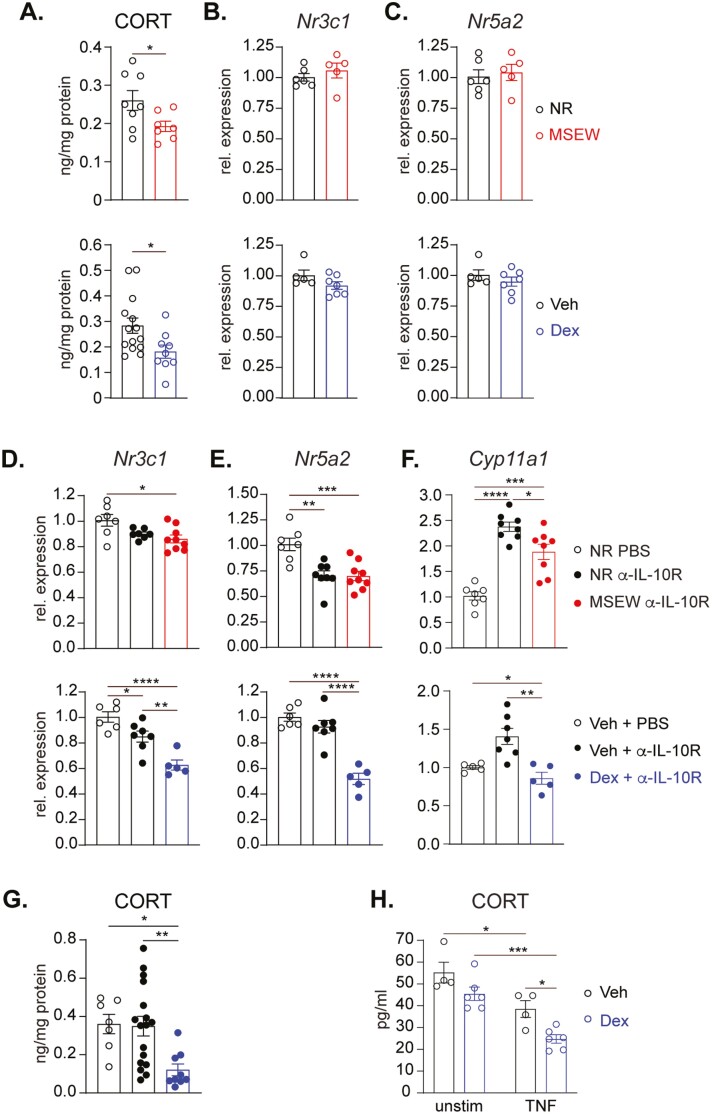
Figure 4.
ELS and TNF suppress colonic CORT output. A, Corticosterone concentration in supernatant after 48-hour cultures of colon from 8-week-old NR and MSEW (upper); and Veh and Dex mice (lower; n ≥ 7). B, Relative expression of Nr3c1 and (C) Nr5a2 in proximal colons of healthy NR versus MSEW (upper) and Veh versus Dex (lower) mice (n ≥ 5). D-F, Relative expression of (D) Nr3c1, (E) Nr5a2, and (F) Cyp11a1, in proximal colons of α-IL-10R–treated NR and MSEW mice (upper), and Veh and Dex mice (lower), normalized to PBS-treated NR and Veh mice, respectively (n ≥ 7). All transcripts were initially normalized to Tbp. G, Corticosterone concentration in supernatant after 48-hour cultures of colon from 8-week-old α-IL-10R–treated Veh and Dex mice at Day 30 (n ≥ 9). H, Corticosterone concentration as determined by ELISA in supernatant of proximal colonic crypt cells generated from 8-week-old Veh and Dex mice stimulated or not with 10 ng/mL TNF stimulation for 48-hour (n ≥ 4). Error bars represent mean ± SEM. Asterisks denote significant differences from Student’s t test at (A), 1-way (D-G) or 2-way (H) ANOVA followed by Tukey’s multiple comparisons test at *P < .05, **P < .01, ***P < .001, and ****P < .0001.

